
01 · Why Inference Servers Exist
Every tool exists because something before it hurt. vLLM's predecessor wasn't a worse model — it was the same model, wrapped in twenty lines of perfectly reasonable Python, serving one request at a time while a $10,000 GPU sat mostly idle. This page is about what actually goes wrong in that world, why the obvious fix (batch the requests) makes it worse in a new way, and what a real inference server does differently.
No GPU needed to read this. There's a runnable experiment at the end if you want one.
The Problem
You have a model and a GPU. You do the obvious thing:
# server.py — the naive version. This is not a strawman; it is what everyone writes first.
from fastapi import FastAPI
from transformers import AutoModelForCausalLM, AutoTokenizer

app = FastAPI()
tok = AutoTokenizer.from_pretrained("Qwen/Qwen2.5-0.5B-Instruct")
model = AutoModelForCausalLM.from_pretrained(
    "Qwen/Qwen2.5-0.5B-Instruct", device_map="cuda", dtype="float16"
)

@app.post("/generate")
def generate(prompt: str):
    inputs = tok(prompt, return_tensors="pt").to("cuda")
    out = model.generate(**inputs, max_new_tokens=256)
    return {"text": tok.decode(out[0], skip_special_tokens=True)}
This works. You test it, it answers, you ship it. Then:
- Two users. The second one waits for the first. Not "waits a bit" — waits for the entire
generation, because a GPU running one
generate()call is not going to interleave another. - Ten users. Timeouts. Your p99 response time is roughly ten times your p50, and it is not obvious from any single log line why.
- You look at
nvidia-smi. Memory is at 95%. GPU utilisation is bouncing between 20% and 60%.
That last pair is the paradox worth sitting with, because it's the entire justification for this category of software: the GPU is simultaneously full and idle. Full of memory it isn't using productively, idle of the arithmetic it's actually good at. Everything vLLM does is an attack on one half or the other of that sentence.
Here is what's actually going wrong, in five specific ways. "It doesn't scale" is not an argument anyone should accept.
1. One request at a time wastes almost the whole GPU
To generate one token, the GPU must read every weight in the model out of its memory. For a 0.5-billion-parameter model in 16-bit precision that's about 1 GB of reading, per token, per request. A Colab T4 has roughly 320 GB/s of memory bandwidth, so the floor on one decode step is around 3 milliseconds — and that floor exists no matter how few tokens you're producing.
The important part: reading those weights to produce one token and reading them to produce thirty-two tokens (for thirty-two different users) costs almost exactly the same. Batch size 1 pays full price for a single token. This is not an inefficiency you can optimise away with better code; it's the shape of the hardware. The only fix is to have more work in flight.
2. Static batching creates a convoy
So you batch. Collect requests for 50 ms, run them together, return them together. This is static batching — also called request-level batching — and it is what every non-LLM ML serving system does, correctly, because image classification requests all take the same amount of time.
Text generation doesn't. One request stops after 12 tokens; another runs to 800. In a static batch, all of them occupy their slot until the longest one finishes. Eleven users got their answer 700 token-steps ago and are still waiting for the transport to leave, and the GPU is doing arithmetic on rows of padding.
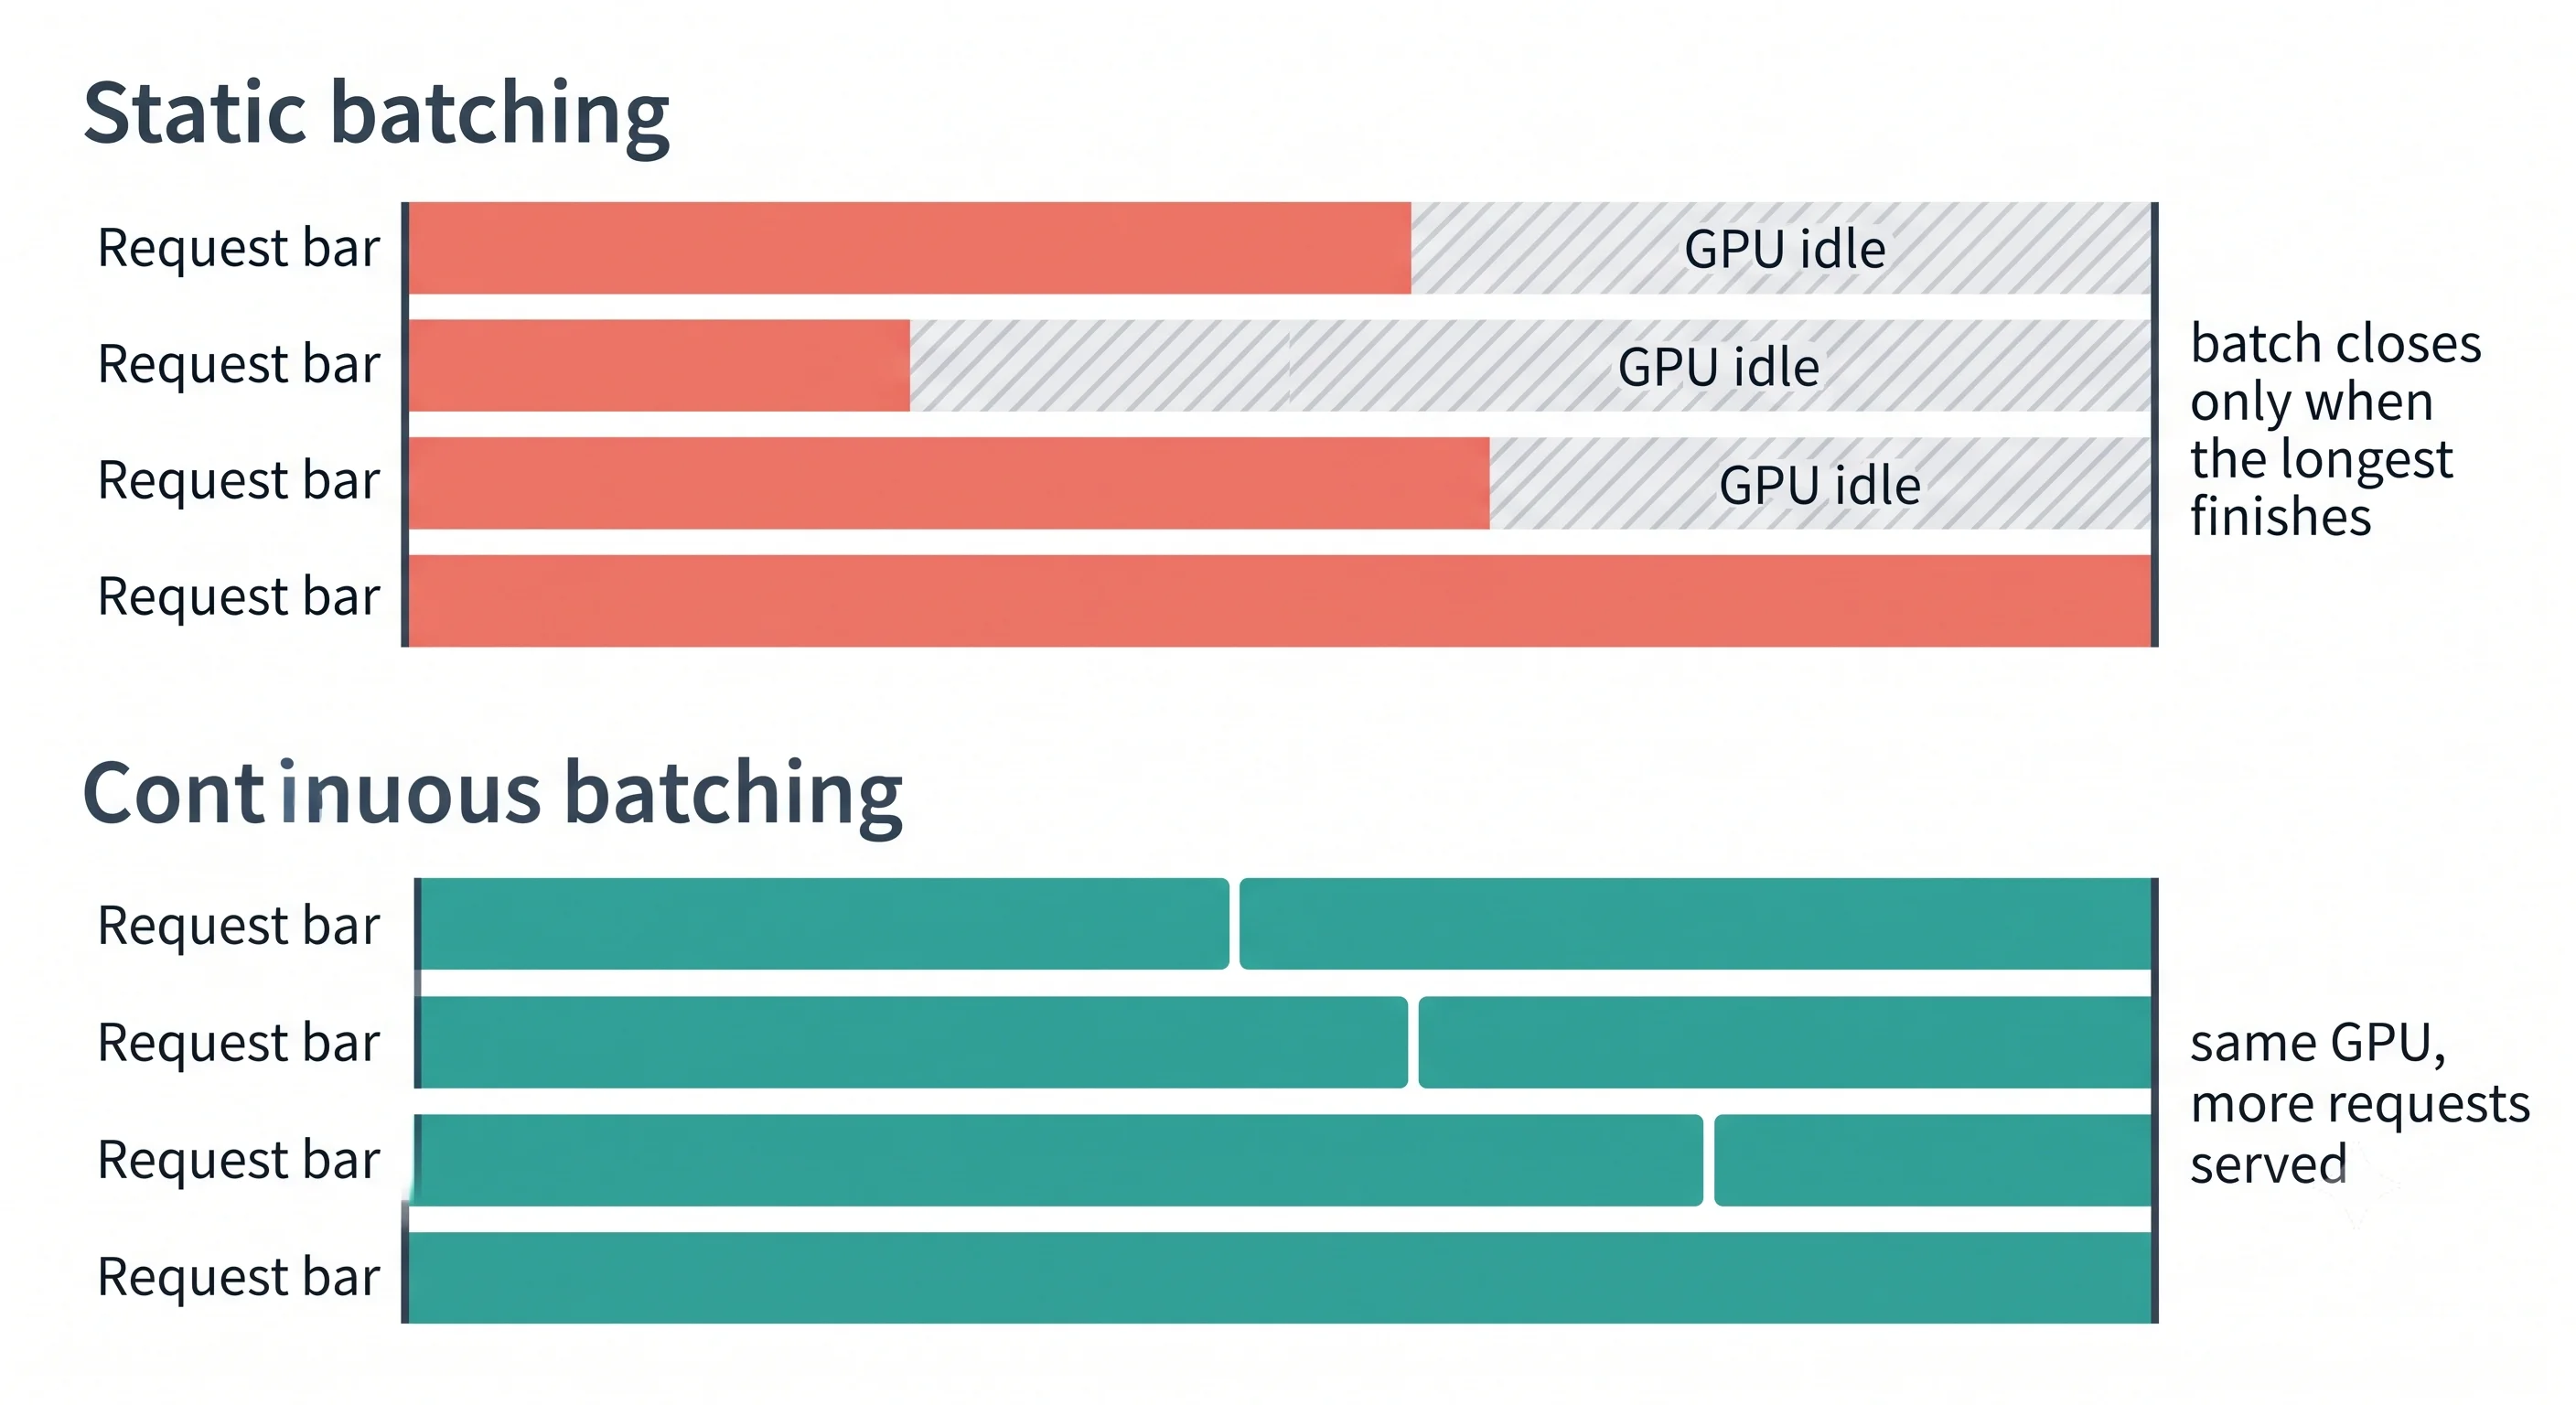
This has a name in queueing theory — head-of-line blocking — and it is the specific failure that made LLM serving a separate research problem rather than an application of existing serving infrastructure.
3. The KV cache is enormous and you reserved it wrong
Generating text autoregressively means every new token attends to every previous token. Recomputing those previous tokens' attention state each step would be quadratic and absurd, so it's cached — the KV cache (key-value cache), covered properly in The KV Cache. For now, two facts:
- It is per request, not shared. Every concurrent user has their own.
- It is large. Hundreds of kilobytes to roughly a megabyte per token for models in the 7B–13B range, which means a single 4,000-token conversation can want gigabytes.
Naive implementations allocate it by asking "what's the longest this could get?" and reserving that much upfront — because the tensor has to be contiguous, so it can't be grown later. A request that could generate 2,048 tokens and actually generates 30 has reserved 98% of its memory for nothing. That memory is unavailable to other requests, which is why your GPU is full while doing very little.
4. What's left over is fragmented
Even the memory you don't over-reserve gets chopped up. Sequences finish at different times and leave contiguous-but-unusable gaps between the live ones — external fragmentation, the exact problem operating systems solved in the 1960s. You have 3 GB free and cannot fit a 1 GB request because it isn't 1 GB in a row.
Add over-reservation and fragmentation together and measurements on pre-vLLM systems put the waste at 60–80% of KV cache memory. Only a fifth to two-fifths of the memory you paid for was holding anything real.
5. Everything shared is recomputed
Every request in a production application starts with the same 400-token system prompt. Every RAG request re-sends the same retrieved chunks. Every turn of a chat re-sends the entire conversation so far. The naive server computes and stores all of it, per request, every time — with no idea that a thousand identical prefixes just went through it.
The trade-off underneath all five
Two numbers, and they pull in opposite directions. Define them precisely now, because most confusing conversations about inference performance are two people optimising different ones:
Throughput — how much work the whole system does. Tokens per second across all users, or requests completed per second. This is what your GPU bill is divided by.
Latency — how long one user waits. Which splits in two, and the split matters:
- Time to first token (TTFT) — from request arrival to the first token appearing. This is what a human perceives as "did it respond?"
- Inter-token latency (ITL), also called time per output token (TPOT) — the gap between subsequent tokens. This is what a human perceives as "is it typing fast?" Around 20–30 tokens per second reads as faster than most people, which is why streaming works.
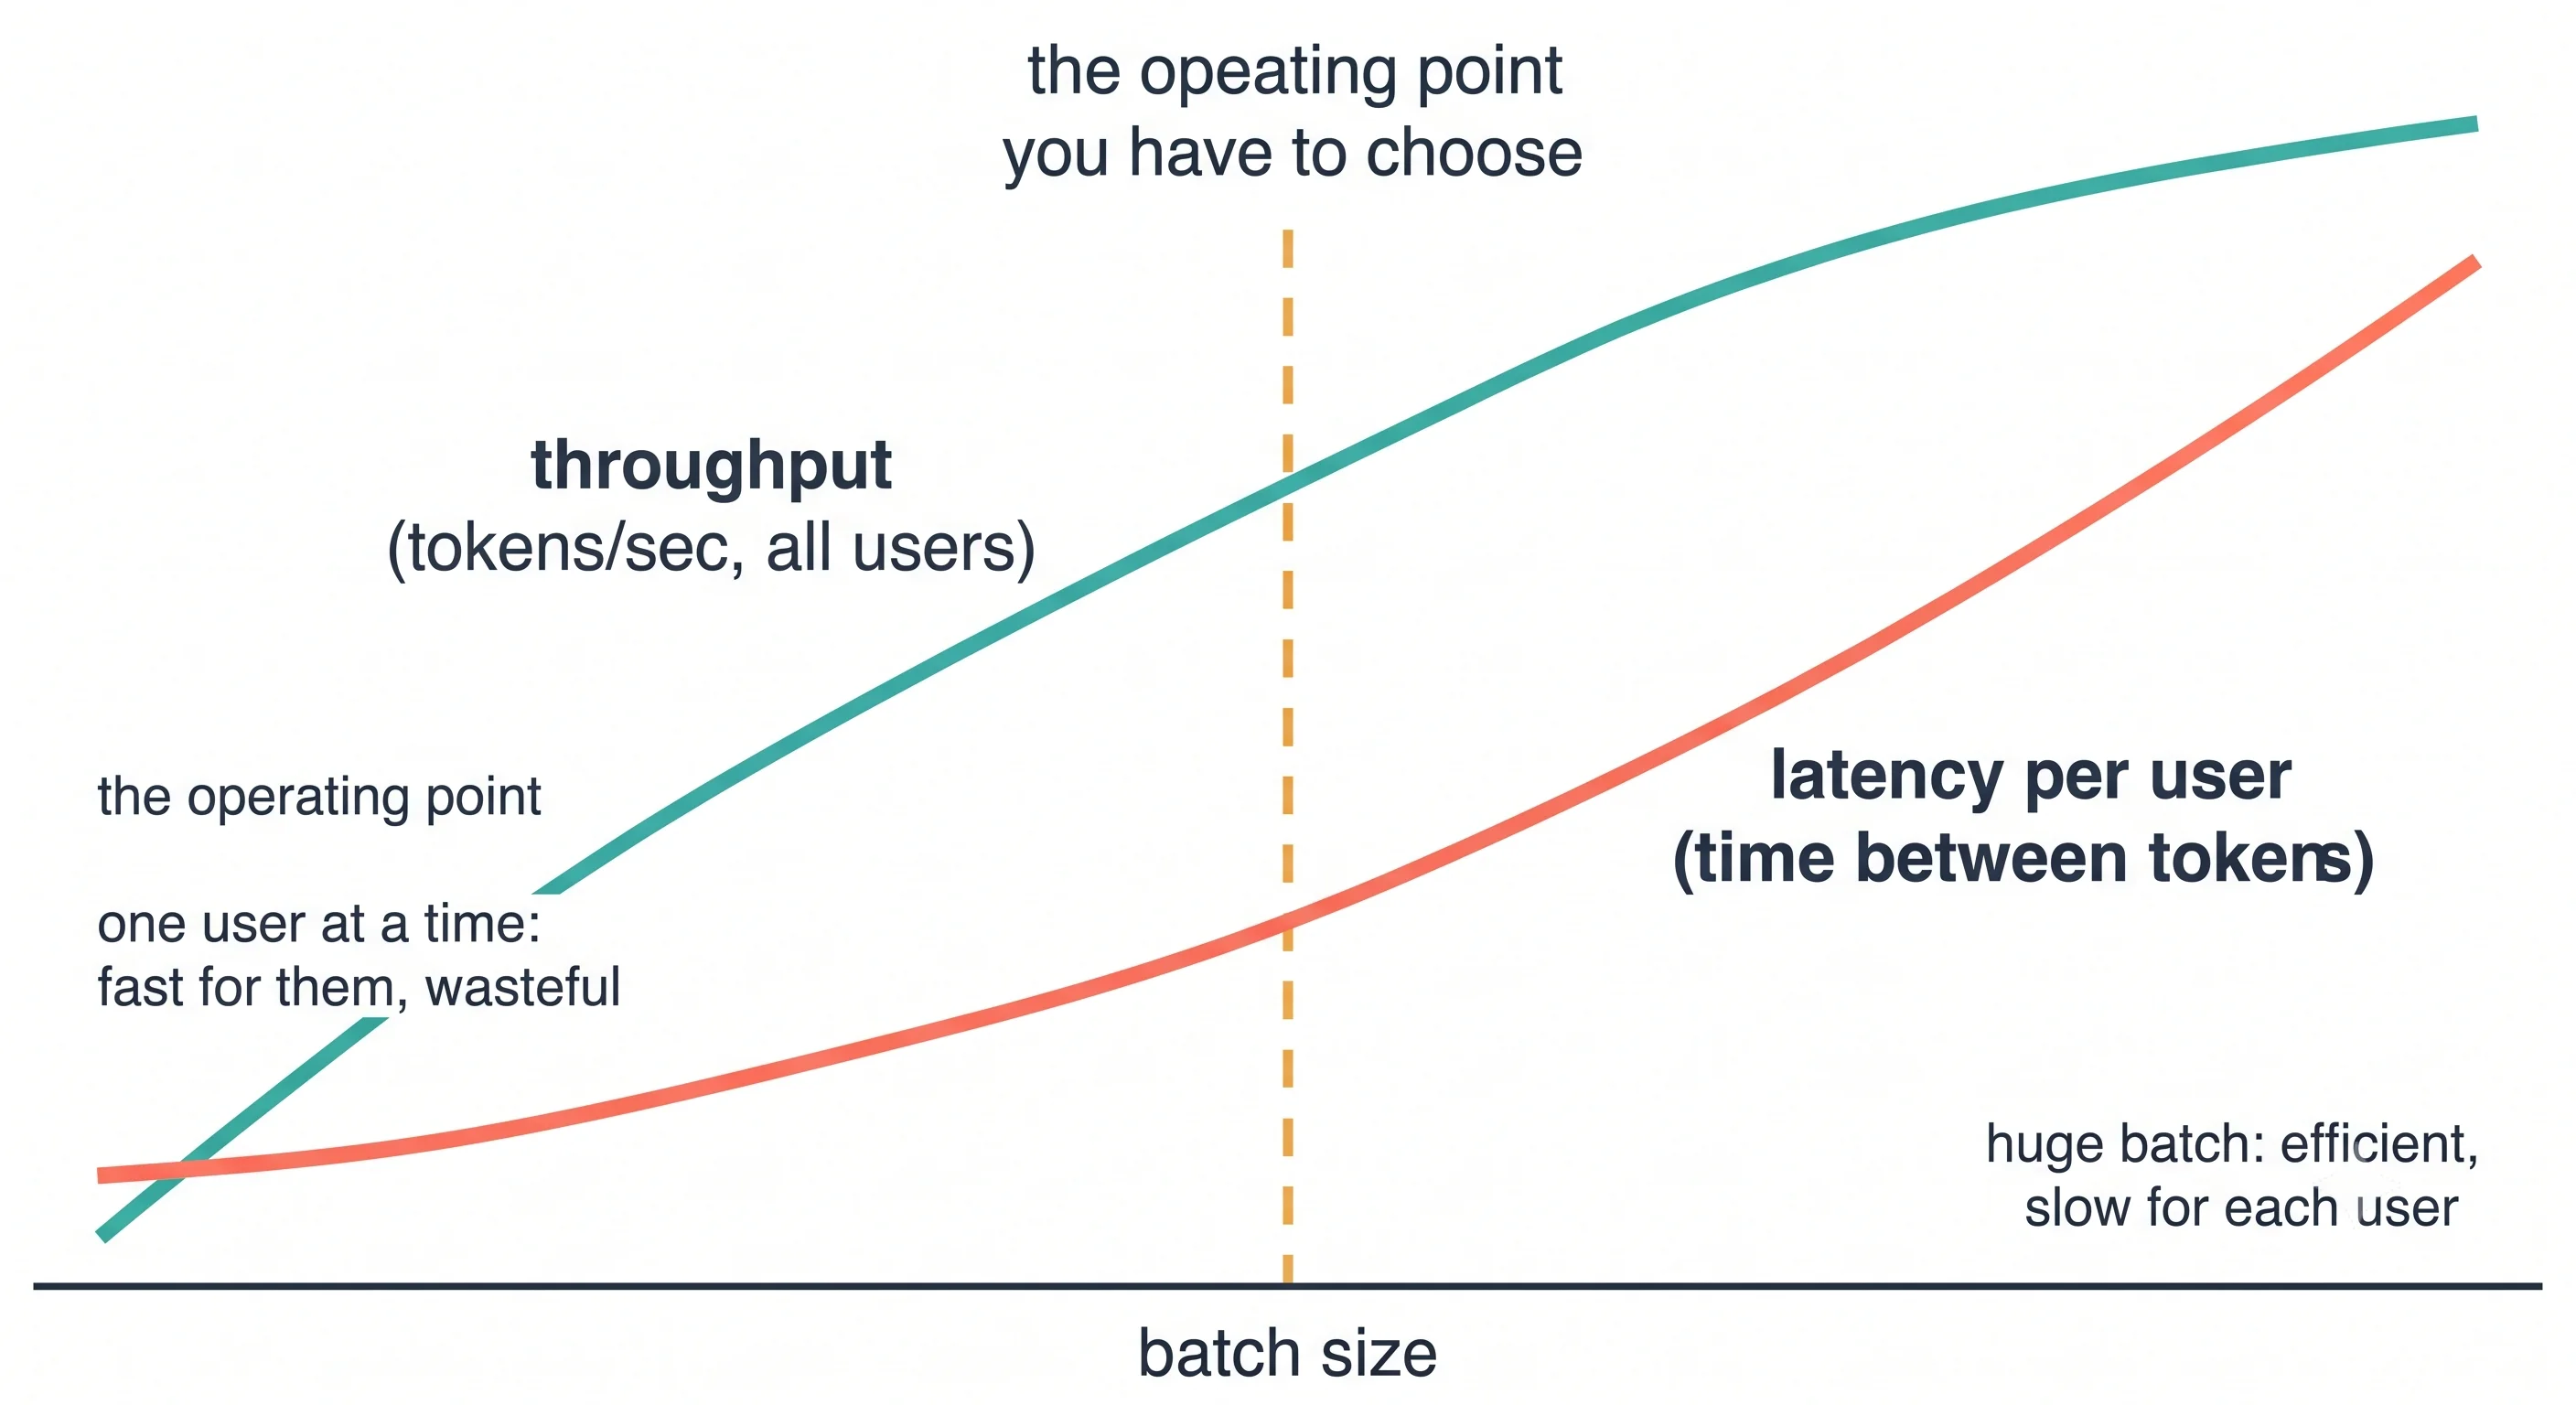
Batching more requests together raises throughput and raises per-user latency. There is no configuration that maximises both. An inference server's job is not to make this trade-off go away — it's to move the whole curve, so that any latency you're willing to accept buys more throughput than it used to. Anyone who tells you their serving framework improves latency and throughput simultaneously is comparing against a badly configured baseline.
The Idea
You have a kitchen. It makes one excellent dish at a time, start to finish, and then starts the next. This is fine. It is, in fact, how you should cook at home.
A restaurant with the same stove and the same chef serves eighty covers a night, and it does so without cooking anything faster. What changed is everything around the cooking: orders are taken and queued rather than blocking the door; several dishes are on the heat at once because the stove has room; a dish that finishes early goes out immediately rather than waiting for the table's slowest order; the stock that every dish starts from is made once, not eighty times; and someone at the pass is deciding, continuously, what goes on next.
An inference server is that someone. It does not make your model faster. Given one user and no contention, a well-tuned naive script and vLLM will produce tokens at roughly the same rate — vLLM may even start slower, because it spends time on startup preparing for a load that hasn't arrived. What the server does is ensure that the expensive thing you bought is never doing nothing, and never holding memory it isn't using.
Three commitments follow from the analogy, and they map onto the rest of Stage 1:
| The kitchen | The server | Covered in |
|---|---|---|
| Several dishes on the heat, swapped as they finish | Continuous batching — the batch changes every single step, not every request | Continuous Batching |
| Ingredients drawn from bins as needed, not pre-plated | PagedAttention — memory in small blocks, allocated on demand | PagedAttention |
| Stock made once and shared | Prefix caching — identical prompt prefixes computed once | Prefix Caching |
Under the Hood
The mechanism that makes text generation different from every other kind of model serving is that one request is not one forward pass. It is hundreds, in sequence, and you don't know how many.
One request, two very different phases
prompt: "Explain paged memory in one sentence."
        │
        ├─ PREFILL   ─ one forward pass over all N prompt tokens at once
        │              → highly parallel, saturates the GPU's arithmetic
        │              → produces the KV cache for the prompt + the first output token
        │
        └─ DECODE    ─ one forward pass per output token, each depending on the last
                       → batch of 1 token wide; reads all weights to produce one token
                       → memory-bandwidth bound; the GPU's arithmetic units mostly idle
                       → repeats until a stop token or max_tokens
Both phases run the same weights. They have almost nothing else in common, and treating them as one thing is why naive serving performs the way it does. This split is the subject of Prefill vs Decode; what matters here is the consequence:
Decode is the phase you spend nearly all your time in, and it is the phase where a batch of one wastes the machine. The arithmetic:
| Batch 1 | Batch 32 | |
|---|---|---|
| Weight bytes read per step | ~1 GB | ~1 GB (the same weights) |
| Time at 320 GB/s (T4) | ~3 ms | ~3 ms (plus a little) |
| Tokens produced per step | 1 | 32 |
| Effective tokens/sec | ~320 | ~10,000 |
Those numbers are a floor, not a prediction — real throughput is lower and the scaling flattens once you become compute-bound rather than bandwidth-bound. But the shape is right, and the shape is the lesson: the single most valuable thing an inference server does is keep the batch full.
Why it can't just keep the batch full
Because batch slots cost KV cache, and KV cache is finite. Concretely, on a 16 GB T4 running a model whose weights take 1 GB, you have roughly 14 GB left for cache after overhead. If a request's cache costs 12 KB per token and averages 1,000 tokens, that's 12 MB per request and you could hold on the order of a thousand. If instead you're running a 7B model where cache costs ~128 KB per token, the same 1,000-token request costs 128 MB and you can hold about a hundred — assuming zero waste.
So the server's actual job is a resource allocation problem with three moving parts:
- How much memory does each in-flight request need right now? (Not at its maximum — right now.)
- Which waiting requests can be admitted without running out?
- What do you do when you guessed wrong and a running request needs memory you don't have?
The naive server answers these with "the maximum, always", "as many as fit under that assumption", and "crash". vLLM answers them with paged allocation, an iteration-level scheduler, and preemption — which are, respectively, PagedAttention, Continuous Batching and The Scheduler & Block Manager.
Where the improvement actually comes from
Two independent contributions, from two different papers, that people routinely conflate:
Iteration-level scheduling (Orca, OSDI 2022) — make the scheduling decision every token step rather than every request. A finished sequence leaves the batch immediately and a waiting one takes its place mid-flight. This is what "continuous batching" means, and it is the fix for failure #2.
PagedAttention (vLLM, SOSP 2023) — store the KV cache in fixed-size blocks that need not be contiguous, with a per-sequence block table mapping logical positions to physical blocks. This is the fix for failures #3 and #4, and it reported cutting KV cache waste from 60–80% down to under 4%.
The second enables more of the first: less wasted memory means more sequences fit, and more sequences in flight means a fuller batch. That compounding is where the headline "2–4× throughput at the same latency" comes from — not from any change to the model or the math.
⚠️ Those figures are from the original papers, against the baselines those papers chose, on the hardware and models they tested. They are the right order of magnitude and the wrong number for your workload. The point of Benchmarking is that you measure your own.
Try It
Hardware: free Colab T4 (16 GB) or any CUDA GPU with ≥8 GB. Runs on CPU, extremely slowly, and the comparison stops being meaningful — see the note at the end.
The experiment is not "look, vLLM works." It's: hold the model, the hardware and the prompts fixed, change only how requests are fed to the GPU, and watch the throughput number move.
Setup
pip install vllm transformersRun A — the naive loop
# naive.py — one request at a time, the way you'd write it first.
import time
from transformers import AutoModelForCausalLM, AutoTokenizer

MODEL = "Qwen/Qwen2.5-0.5B-Instruct"
PROMPTS = [f"Write one sentence about the number {i}." for i in range(32)]

tok = AutoTokenizer.from_pretrained(MODEL)
model = AutoModelForCausalLM.from_pretrained(MODEL, device_map="cuda", dtype="float16")
# NB: older transformers wants torch_dtype=; it is deprecated in favour of dtype=

start = time.perf_counter()
total_tokens = 0
for p in PROMPTS:
    inputs = tok(p, return_tensors="pt").to("cuda")
    out = model.generate(**inputs, max_new_tokens=128, do_sample=False)
    total_tokens += out.shape[1] - inputs["input_ids"].shape[1]
elapsed = time.perf_counter() - start

print(f"naive:   {elapsed:6.1f}s  {total_tokens/elapsed:7.1f} output tok/s")
Run B — the same work, through vLLM
# batched.py — identical model, identical prompts, identical sampling.
import time
from vllm import LLM, SamplingParams

MODEL = "Qwen/Qwen2.5-0.5B-Instruct"
PROMPTS = [f"Write one sentence about the number {i}." for i in range(32)]

llm = LLM(model=MODEL, gpu_memory_utilization=0.85)   # engine startup happens here
params = SamplingParams(temperature=0.0, max_tokens=128)

start = time.perf_counter()                            # timed AFTER startup, deliberately
outs = llm.generate(PROMPTS, params)
elapsed = time.perf_counter() - start

total_tokens = sum(len(o.outputs[0].token_ids) for o in outs)
print(f"batched: {elapsed:6.1f}s  {total_tokens/elapsed:7.1f} output tok/s")
# UNVERIFIED — needs a Colab T4 run. See docs/VERIFICATION.md, session 1 item 1.
# Indicative shape only; the ratio is the point, not the absolute values.
naive: 118.4s 34.6 output tok/s
batched: 6.9s 593.8 output tok/sThe ratio is what matters, not the absolute values. Same weights, same GPU, same 4,096 output tokens. The only thing that changed is that the second one had 32 sequences in flight instead of 1.
Now change one thing
This is the actual experiment. Re-run Run B with PROMPTS truncated to different lengths and
record output tokens/sec:
for n in [1, 2, 4, 8, 16, 32, 64]:
    start = time.perf_counter()
    outs = llm.generate(PROMPTS[:n], params)          # reuse the same llm object
    elapsed = time.perf_counter() - start
    toks = sum(len(o.outputs[0].token_ids) for o in outs)
    print(f"n={n:3d}  {elapsed:5.1f}s  {toks/elapsed:7.1f} tok/s  "
          f"{elapsed:5.1f}s per request wall-clock")
What you should observe, and what each observation means:
| Observation | What it tells you |
|---|---|
At n=1, vLLM's tokens/sec is unremarkable — possibly worse than the naive loop |
vLLM does not make a single request faster. Failure #1 is a throughput problem, not a latency one |
From n=1 to n=16, total tokens/sec rises close to linearly |
Each additional sequence is nearly free, because the weight read was already paid for |
Wall-clock time for the whole batch barely changes as n grows |
The same evidence from the other side: you're adding work without adding time |
Past some n, tokens/sec flattens and wall-clock starts climbing |
You've stopped being memory-bandwidth bound and become compute bound, or you've run out of KV cache and requests are queueing. Distinguishing those two is Reading Logs & Metrics |
Watch the startup log while the engine boots. Somewhere in it is a line reporting how many GPU blocks were allocated. That number, times the block size in tokens, is your entire concurrent token capacity — the thing failures #3 and #4 were wasting. You'll meet it properly in PagedAttention.
On CPU: the CPU backend is fully supported — vLLM lists it alongside NVIDIA, AMD, Intel GPU and TPU as functional. But it's a different execution backend with different performance characteristics, and the memory-bandwidth argument above doesn't hold the same way there. Run these scripts on CPU to see them work; don't draw conclusions about batching economics from the numbers.
Where It Bites You
"vLLM will make my model faster." It will not. It makes your server handle more concurrent requests at a given latency. If you have one user, or a strict single-request latency target with no concurrency, vLLM's advantage is small and its startup cost, memory pre-allocation and operational surface are real costs you're paying for nothing. That's a genuine case for llama.cpp or Ollama.
Benchmarking with identical prompts. The most common self-inflicted wound. Send the same prompt 32 times and, if prefix caching is enabled, 31 of them are served largely from cache — so your benchmark reports a number you will never see again in production. Vary your prompts, and check whether prefix caching is on before interpreting any result. This trap gets its own treatment in Benchmarking and the mechanism in Prefix Caching.
Quoting "tokens per second" without saying whose. 600 tok/s of aggregate throughput across 32 users is 19 tok/s each — noticeably slow to read. 600 tok/s for one user is impossible on most hardware. The number is meaningless without the concurrency it was measured at, and a surprising amount of vendor benchmarking depends on you not noticing that.
Trusting nvidia-smi's utilisation percentage. It reports the fraction of time any kernel was
running, not how much of the GPU's capability was used. A decode step that reads all your weights to
produce one token registers as 100% utilised while wasting most of the machine. Use it to check the
GPU exists and how much memory is allocated; use vLLM's own metrics for anything else.
Assuming static batching is fine because your outputs are "all about the same length". They are not. Stop sequences fire at different points, refusals are short, one user pastes a document. And the cost isn't the average — it's the maximum, on every batch, forever.
Reaching for a bigger GPU first. The instinct when a server is slow is more VRAM. Frequently the
actual problem is that max_num_seqs or gpu_memory_utilization is capping concurrency far below
what the current card supports, and you'd get the improvement for free. Measure before you buy:
Memory & Capacity Tuning.
In Production
What the server owns that your FastAPI wrapper didn't. Once real traffic arrives, "run the model" turns out to be a small part of the job. An inference server also owns: admission control and queueing; streaming responses token by token over SSE; noticing a client disconnected and freeing its KV cache instead of finishing an answer nobody will read; per-request metrics; and shutting down without dropping in-flight streams. Every one of those is something you'd otherwise write yourself, badly, after an incident.
The signal to watch, at this stage. One: queue depth — the number of requests waiting rather than running. Latency percentiles tell you that something is wrong after users have felt it; queue depth tells you the same thing earlier and points at the cause. A server with a persistently non-zero waiting queue is at capacity, whatever its GPU utilisation says. The full metric set is Observability.
What changes at 10× traffic. The naive server degrades non-linearly: requests arrive faster than they're served, the queue grows without bound, and every user's latency climbs together until timeouts cascade. A properly configured inference server degrades in two distinct stages instead — first gracefully, as per-user latency rises while the batch fills and throughput holds; then sharply, when KV cache runs out and the scheduler must start preempting running requests. Those are different failures with different fixes, and being able to tell them apart from the logs is most of Reading Logs & Metrics.
The capacity planning consequence. Your capacity is not "requests per second." It's a surface over concurrency, prompt length and output length, because all three consume the same scarce KV cache. A server sized for 100 concurrent 500-token chats will fall over at 20 concurrent 20,000-token document summaries, on identical hardware. Any capacity number stated without those three dimensions is a number someone made up.
Check Yourself
Recall the idea
Why can't you serve an LLM the way you'd serve an image classifier?
Because one request is not one forward pass. Text generation is autoregressive — one forward pass per output token, sequentially, and you don't know in advance how many there will be. That breaks the two assumptions image serving relies on: that a batch's members finish together, and that memory requirements are known at admission time.
Your GPU shows 95% memory used and low utilisation. What's the most likely explanation?
Memory is reserved but not doing productive work — over-reserved KV cache — while the arithmetic units idle because there aren't enough sequences in flight to keep them fed. "Full and idle" is the signature of naive serving, and it's the paradox both PagedAttention and continuous batching attack.
Define throughput, TTFT and ITL, and say which one a user notices.
Throughput is total tokens (or requests) per second across all users — the number your cost divides by. TTFT is the delay before the first token appears; ITL is the gap between subsequent tokens. Users notice TTFT as responsiveness and ITL as typing speed, and notice throughput not at all — until it's low enough that they're queueing, at which point they experience it as TTFT.
What is head-of-line blocking in a static batch?
Every request in the batch holds its slot until the longest request finishes, because the batch is scheduled as a unit. Requests that completed early are done but not returned, and the GPU computes over padding on their behalf.
Explain the mechanics
Why does batch size 1 waste a GPU during decode, in a way that better code can't fix?
Each decode step must read every model weight out of GPU memory to produce its output. That read is fixed and dominates; the arithmetic on a single token is trivial by comparison, so the step is memory-bandwidth bound. Producing 32 tokens for 32 different sequences reads the same weights once. Batch 1 therefore pays the full memory cost for 1/32nd of the output. No kernel optimisation removes this — the only lever is more sequences in flight.
Where does the 60–80% KV cache waste in naive systems come from?
Two sources. Over-reservation: the cache must be a contiguous tensor, so it's allocated at the maximum possible sequence length, and a request that generates 30 of a possible 2,048 tokens wastes the rest. Fragmentation: sequences finish at different times and leave gaps too small or too scattered to reuse, so free memory exists but not in usable runs.
Iteration-level scheduling and PagedAttention are separate ideas. What does each fix, and how do they compound?
Iteration-level scheduling (Orca) re-decides the batch every token step, so a finished sequence is replaced immediately — that fixes head-of-line blocking. PagedAttention (vLLM) stores the KV cache in non-contiguous fixed-size blocks with a per-sequence block table — that fixes over-reservation and fragmentation. They compound because reclaimed memory becomes batch slots: the memory fix directly raises the ceiling on how full the scheduler can keep the batch.
Why does adding requests to a batch increase throughput without proportionally increasing wall-clock time — and where does that stop?
Because the dominant per-step cost (reading weights) is shared across the batch, so additional sequences ride along nearly free while you're memory-bandwidth bound. It stops in one of two ways: the arithmetic eventually becomes the bottleneck instead of the memory reads and you go compute-bound, or you run out of KV cache and new requests queue rather than joining the batch. The symptoms differ — the first flattens throughput, the second grows the waiting queue.
Reason about a trade-off
A colleague reports that vLLM made their service slower. Is this plausible?
Entirely, and it's worth taking seriously rather than assuming misconfiguration. If the service is low-concurrency — one user, or a batch job with strict per-request deadlines — there's no contention for the scheduler to exploit, and vLLM's engine startup, memory pre-allocation and any speculative or graph-capture work are overhead against no benefit. The right response is to ask what concurrency they measured at. If it's genuinely one, the honest answer may be that vLLM is the wrong tool: see Where vLLM Sits.
You need p99 TTFT under 500 ms and maximum tokens per dollar. How do you approach this?
You accept that you're choosing a point on a curve, not satisfying both. The productive sequence is: fix the latency target as a hard constraint, then find the largest batch and concurrency that still meets it under a realistic load shape, and take whatever throughput that yields. What you must not do is tune for throughput and check latency afterwards — the batch size that maximises tokens/sec will almost always miss a tight TTFT target. If the resulting cost is unacceptable, the remaining levers are a smaller model, quantisation, or more replicas — not a better batch size.
When is the naive model.generate() loop actually the right answer?
More often than this page implies. A batch job with no latency requirement where you control the whole GPU; a single-user local application; an experiment where the cost of learning a serving framework exceeds the compute you'd save. The failure mode isn't using the simple thing — it's using the simple thing behind an HTTP endpoint with concurrent users, which is where all five failures arrive at once.
A vendor claims 3× throughput and 40% lower latency versus vLLM. What do you ask?
At what concurrency, and against what vLLM configuration. Improvements to both numbers at once usually mean the baseline was configured for a different operating point — a vLLM instance tuned for throughput will show poor latency by construction, and vice versa. Then: which model, which hardware, what prompt and output length distribution, and were prompts varied or repeated (repeated prompts make prefix caching flatter the result). A benchmark that doesn't state its concurrency and load shape isn't reporting a measurement.
Cheat Sheet
The two-sentence version. An inference server doesn't make the model faster; it keeps the GPU's batch full and its memory unwasted. Everything else on this page is a consequence of those two jobs.
The numbers worth memorising
| Number | Why it matters |
|---|---|
| Decode is memory-bandwidth bound | Explains why batching is the whole game, and why batch-1 latency barely improves with a better GPU that has similar bandwidth |
| Batch-1 decode floor ≈ weight bytes ÷ HBM bandwidth | A back-of-envelope you can compute for any model and card before buying either |
| 60–80% KV waste naive, <4% paged | The size of the prize PagedAttention is claiming |
| 2–4× throughput at equal latency | The headline vLLM number — from the paper, against its chosen baseline. Not a promise about your workload |
| ~20–30 tok/s per user reads as fast | The per-user ITL target that lets you decide how much batching you can afford |
Terms defined on this page
| Term | One line |
|---|---|
| Throughput | Tokens or requests per second across all users; what your cost divides by |
| Latency | How long one user waits; splits into TTFT and ITL |
| TTFT | Time to first token — perceived responsiveness |
| ITL / TPOT | Inter-token latency, time per output token — perceived typing speed |
| KV cache | Per-request cached attention state; large, and the scarce resource in LLM serving |
| Static batching | Batching at request granularity; the batch closes only when its slowest member finishes |
| Continuous batching | Batching re-decided every token step; finished sequences leave immediately |
| Head-of-line blocking | Fast work stuck behind slow work in the same scheduling unit |
| Prefill | The single parallel forward pass over the whole prompt; compute-bound |
| Decode | The one-token-at-a-time generation loop; memory-bandwidth bound |
| External fragmentation | Free memory that exists but not in a usable contiguous run |
| Over-reservation | Allocating for the maximum possible length instead of the actual one |
The diagnostic instinct to carry forward
Full memory + low useful work = a memory problem (over-reservation, fragmentation). Empty memory + low useful work = a scheduling problem (batch isn't full, requests are queueing).
Sources
- Kwon et al., Efficient Memory Management for Large Language Model Serving with PagedAttention, SOSP 2023 — arxiv.org/abs/2309.06180
- Yu et al., Orca: A Distributed Serving System for Transformer-Based Generative Models, OSDI 2022 — usenix.org/conference/osdi22/presentation/yu
← Back to Orientation · Next: Where vLLM Sits →
⚠️ Verification checklist (delete before publishing)
Numbers asserted
- T4 memory bandwidth 320 GB/s — confirm the exact figure for the Colab T4 SKU.
- Qwen2.5-0.5B-Instruct fp16 weight size ≈ 1 GB — confirm from the model card.
- "
12 KB per token" KV cache for Qwen2.5-0.5B and "128 KB per token" for a 7B model — both computed from config (2 × layers × kv_heads × head_dim × 2 bytes). Recompute against the actualconfig.jsonfor each before publishing. - The 60–80% waste and <4% figures — verify these are stated as such in the SOSP paper rather than only in secondary summaries.
- The 2–4× throughput claim — confirm the paper's exact framing and baseline.
- Orca's reported speedup is cited in secondary sources as 36.9× over FasterTransformer on GPT-3 175B; not used on this page, but verify before adding it anywhere.
- The batch-1 vs batch-32 table's "~10,000 effective tok/s" — this is a bandwidth-derived ceiling, clearly labelled as a floor/ceiling rather than a measurement. Confirm the framing reads as such and isn't mistakable for a benchmark result.
Code and output
- Run
naive.pyandbatched.pyon a real Colab T4 and replace the UNVERIFIED output block with actual captured numbers. - Resolved:
dtype=is current.torch_dtype=is deprecated in favour ofdtype=(kept as a backward-compatible alias for now). Both snippets on this page updated, with an inline note for readers on oldertransformers. Consistent with Stage 1 and the notebook. - Confirm
LLM(model=..., gpu_memory_utilization=...)signature for the pinned vLLM version. - Confirm
SamplingParams(temperature=0.0, ...)gives greedy decoding, matchingdo_sample=Falsein the naive script — the comparison depends on both being greedy. - Run the
n = [1,2,4,...]sweep and confirm the four claimed observations actually occur, especially thatn=1vLLM is comparable to or worse than the naive loop. - Confirm the startup log still reports a GPU-blocks line, and capture its current wording.
Claims about defaults and support
- The "on by default" assertion has been removed — the claim is now conditional ("if
prefix caching is enabled"), because vLLM's own APC doc says to set
enable_prefix_caching=Trueto enable it, which contradicts the secondary sources claiming V1 defaults it on. - Still unresolved: is prefix caching on by default? Settle definitively on the Prefix Caching page. The wording here is safe either way, so this no longer blocks publication.
- CPU backend status: vLLM's V1 guide lists CPU as 🟢 Functional alongside NVIDIA, AMD, Intel GPU and TPU. The page now states this rather than hedging.
- Confirm the scripts run unmodified on the CPU backend (support ≠ drop-in).
- The claim that vLLM frees KV cache on client disconnect — verify current behaviour.
Rendering
- Both image placeholders replaced with generated assets; paths match
image-prompts.md. - Check both images render at a sensible width on the published site and that their text labels are legible at mobile width.
- All 12 relative links resolve once target files exist. Currently all dead.