
03 · PagedAttention
This is the idea vLLM is named for, and it is not an attention algorithm in the way the name suggests. It is a memory allocator, borrowed almost wholesale from operating systems, that happens to require a modified attention kernel to work.
The previous two pages established that the KV cache is the scarce resource and that it grows one token at a time. This page is about the fact that knowing how much memory you need is not the same as being able to use it — and that the gap between those two, in pre-vLLM systems, was around 60–80% of your GPU.
The Problem
You did the arithmetic from The KV Cache. A 0.5B model on a 16 GB card, 12 KB per token, 12.4 GB of cache, 4,096-token sequences: about 250 concurrent requests.
You run it. It handles sixty. There is no error, nothing in the logs looks wrong, and nvidia-smi
says the memory is allocated. Where did three quarters of your capacity go?
It went to three kinds of waste, and they're worth separating because they have different causes:
1. You had to reserve for the worst case. The KV cache for a sequence must be one contiguous
tensor, and tensors can't be grown in place — something else is already sitting after them in memory.
So the allocation has to be made once, upfront, at the largest size the sequence could reach:
max_model_len. A request that generates 80 tokens of a possible 4,096 has reserved 98% of its
memory for output it never produced.
2. What you did reserve, you can't fully use. Even correctly-sized allocations leave a partial tail — the space between where a sequence actually ended and the round-number boundary its allocation was made at.
3. What's left over is the wrong shape. Sequences finish at different times and free their slabs, leaving holes. A new 2 GB request cannot use 3 GB of free memory that exists as six separate 500 MB holes. This is external fragmentation, and it is the classic memory-allocator failure.
The original vLLM paper measured this on the serving systems that came before it, and the numbers are worse than most people guess:
| System | KV cache memory actually holding token state |
|---|---|
| Prior systems with naive reservation | 20–40% |
| vLLM with PagedAttention | ~96% |
Only a fifth to two-fifths of the memory you paid for was holding anything. That's not a tuning inefficiency you close with a flag. It's a 2–4× capacity difference, and it's most of where vLLM's headline throughput number comes from.
The Idea
Computers had this exact problem in the 1960s, solved it, and the solution is now so ordinary that nobody thinks about it.
The old way. A program needed a contiguous run of physical memory. So it had to declare its maximum size upfront — and a program that might need 1 GB reserved 1 GB even if it used 4 MB. Programs finishing at different times left holes, and eventually you couldn't start a 1 GB program despite having 3 GB free, because no single run of 1 GB existed. Every failure on the previous page's list, thirty years earlier.
The fix: virtual memory. Stop requiring physical contiguity. Chop memory into fixed-size pages. Give each process the illusion of a contiguous address space, and keep a page table mapping each logical page to whatever physical page it actually lives in. Allocate pages on demand as the process grows.
Everything falls out at once. No upfront maximum — grow a page at a time. No external fragmentation — every page is the same size, so any free page fits any request. Waste is bounded to the tail of the last page.
PagedAttention is that, for the KV cache. The mapping is close to exact:
| Operating system | vLLM | What it is |
|---|---|---|
| Page | KV block | A fixed-size chunk — 16 tokens' worth of KV, by default |
| Page table | Block table | Per-sequence map from logical position to physical block |
| Process | Sequence | One request being generated |
| Physical memory | GPU memory reserved for KV cache | The pool blocks are drawn from |
| Bytes | Tokens | The unit being stored |
fork() + copy-on-write |
Block sharing + copy-on-write | Two sequences sharing a prefix |
| Swapping to disk | (no equivalent — see below) | V1 recomputes instead of swapping |
The illusion is the same illusion: a sequence believes its KV cache is one continuous run of tokens. It is actually scattered across the GPU in 16-token pieces, and a table keeps the story straight.
Under the Hood
Blocks and block tables
A KV block holds the keys and values for a fixed number of tokens — block_size, 16 by
default — across all layers and KV heads. Using the 12 KB/token figure for Qwen2.5-0.5B, one block
is about 192 KB.
At startup vLLM measures how much memory is left after weights and overhead, divides by the block size, and allocates the entire pool once. That number appears in your startup log, and it is your real capacity:
total cacheable tokens = num_gpu_blocks × block_sizeEach sequence gets a block table — a small array mapping its logical blocks to physical block numbers:
sequence A, 35 tokens generated so far
  logical block 0  (tokens  0–15)  →  physical block 1102
  logical block 1  (tokens 16–31)  →  physical block   47
  logical block 2  (tokens 32–35)  →  physical block  893   ← 4 of 16 slots used

sequence B, 20 tokens
  logical block 0  (tokens  0–15)  →  physical block  512
  logical block 1  (tokens 16–19)  →  physical block   48   ← 4 of 16 slots used
Physical blocks 1102, 47 and 893 have no relationship to each other in memory. They don't need one.
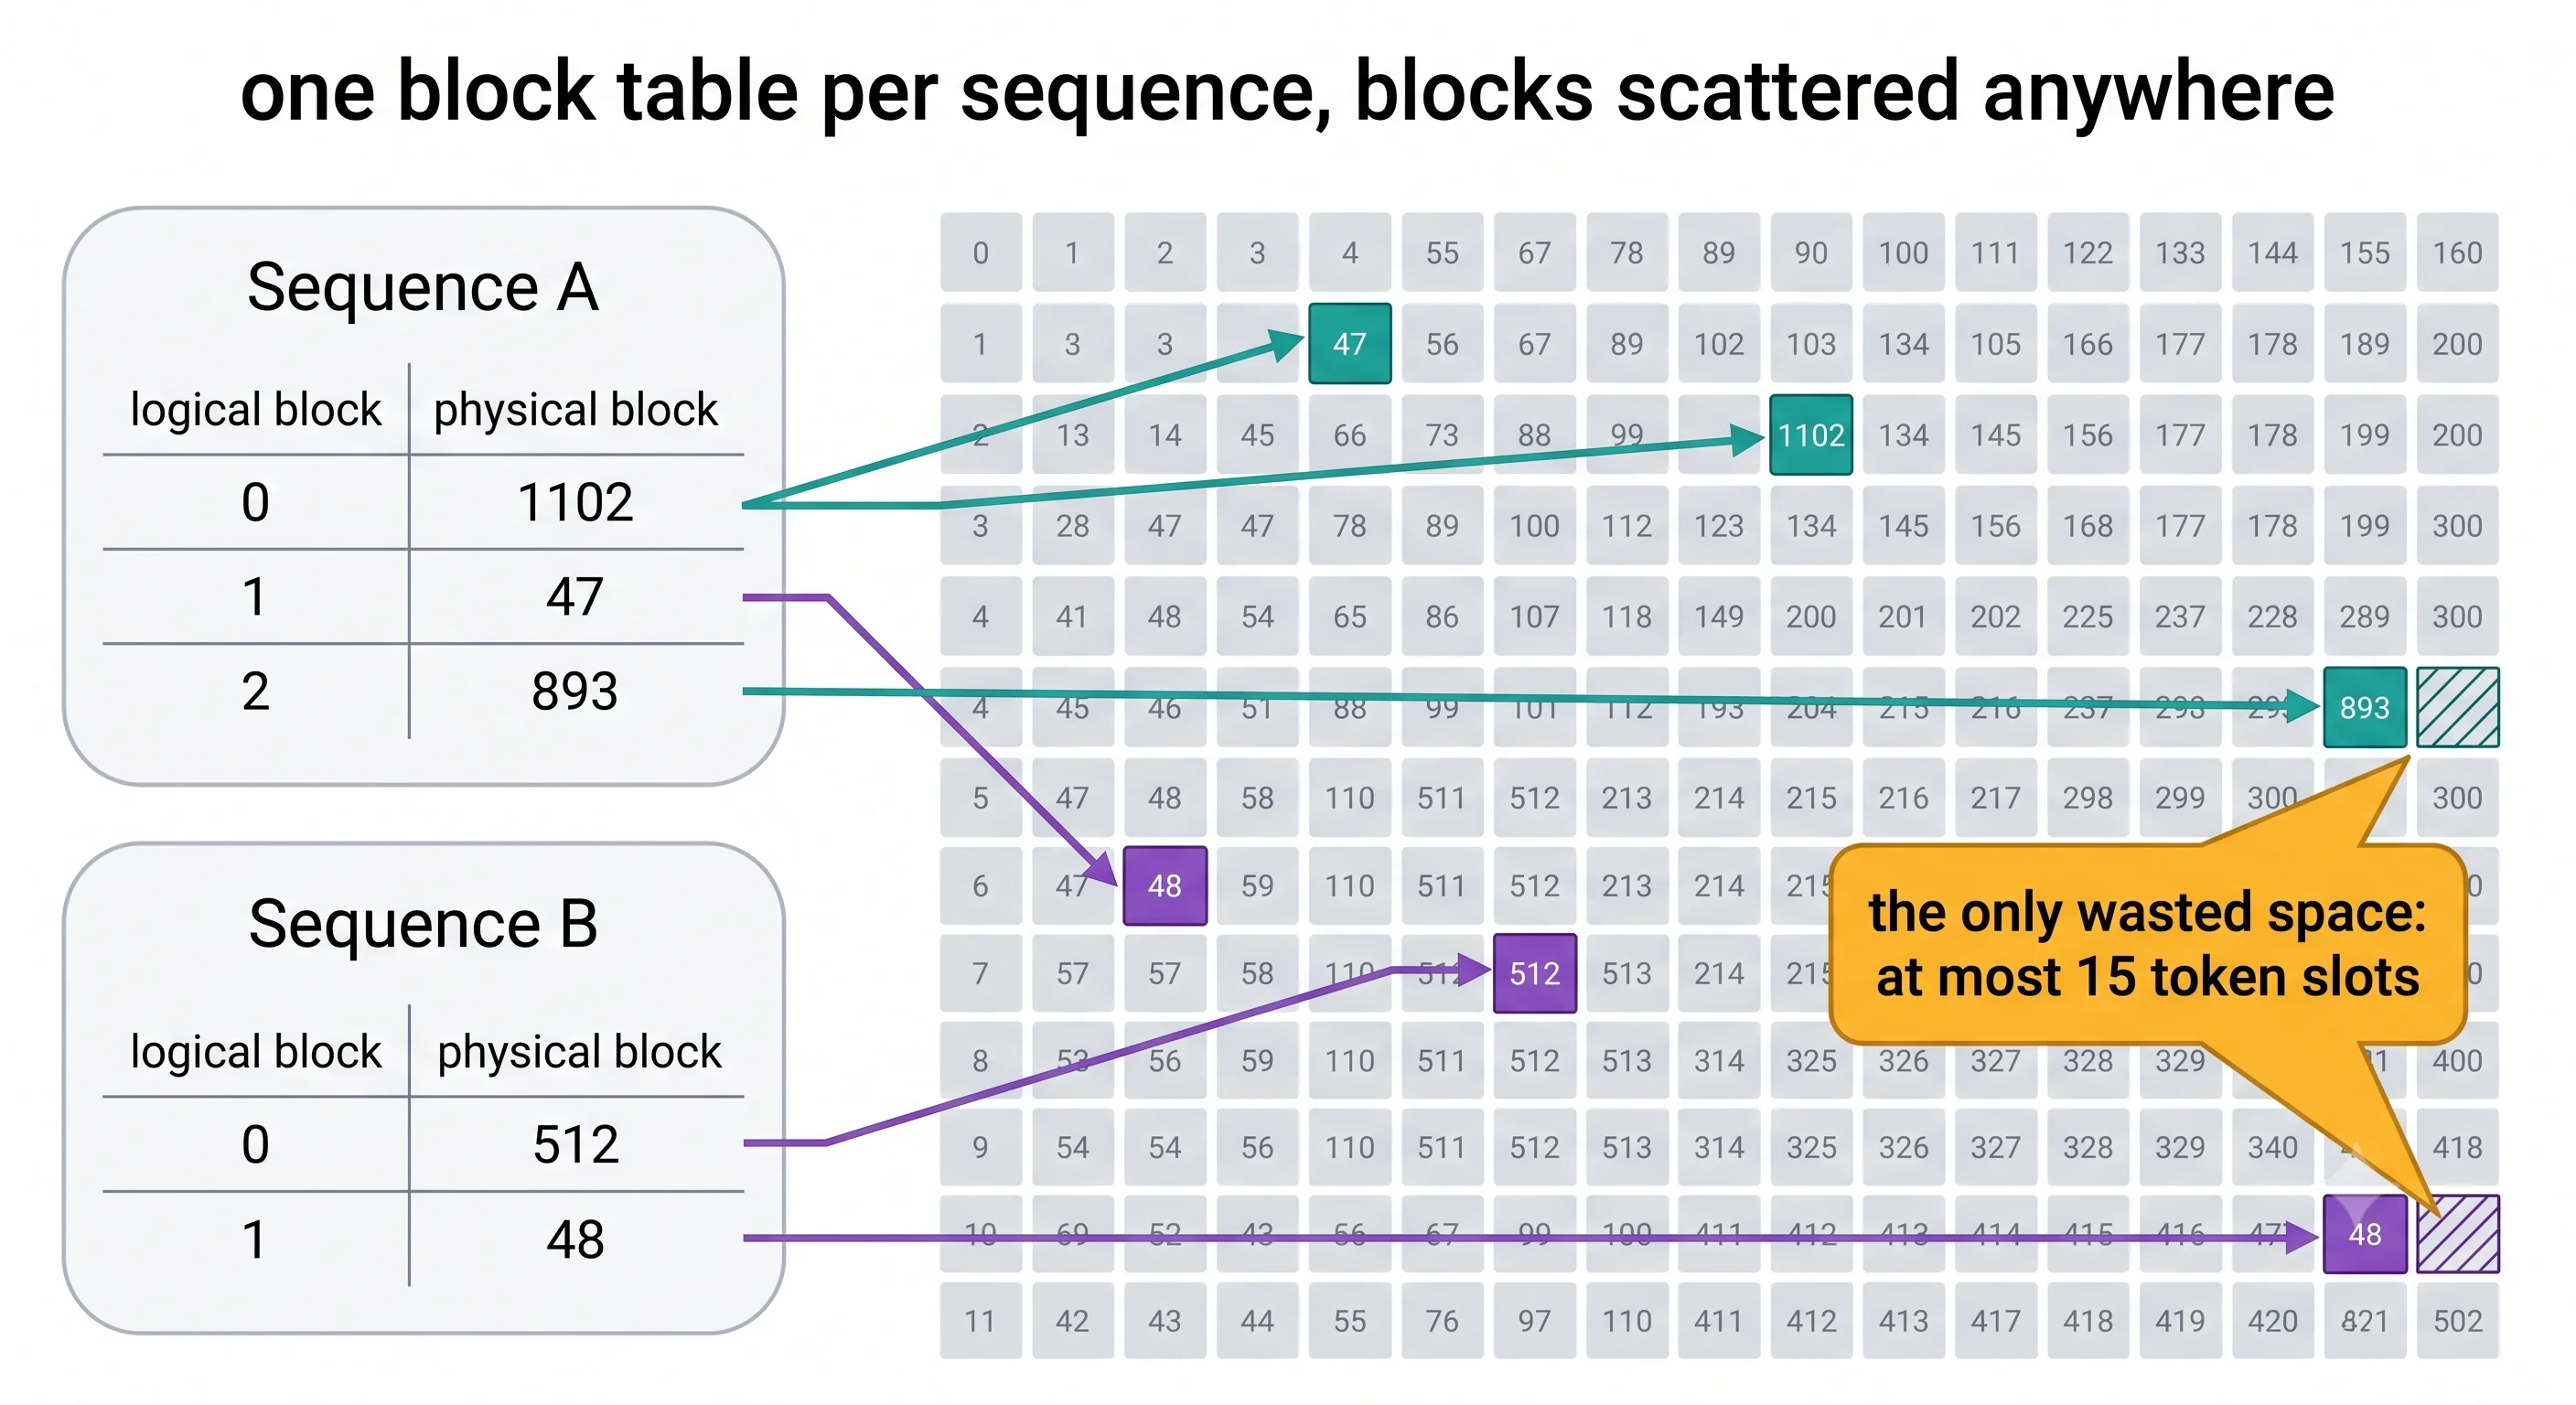
A new block is allocated only when the previous one fills. A sequence generating its 17th token requests a block; generating its 18th through 32nd tokens requests nothing. Memory grows with tokens actually produced, not with tokens hypothetically possible.
Why this eliminates the waste, precisely
Take the three failures in order:
Over-reservation: gone. There is no upfront allocation, so max_model_len stops being a memory
reservation and becomes only a limit. A request that generates 80 tokens uses 5 blocks and returns
them.
External fragmentation: gone, structurally. Every block is identical in size, so any free block satisfies any request. The holes-that-don't-fit problem cannot occur — this isn't reduced, it's eliminated by construction.
Internal fragmentation: bounded, and small. The last block of a sequence is partly empty. Worst
case that's block_size − 1 = 15 wasted token slots, per sequence, ever. As a fraction:
| Sequence length | Blocks used | Wasted slots | Waste |
|---|---|---|---|
| 100 tokens | 7 | 12 | 10.7% |
| 500 tokens | 32 | 12 | 2.3% |
| 2,000 tokens | 125 | 0 | 0% |
| Average, realistic mix | — | ~8 | ~1–3% |
That is the whole of "under 4% waste." Not a clever trick — just the observation that a fixed 15-slot tail is negligible against sequences of hundreds of tokens.
The part the analogy hides: the kernel
Here's what makes this an attention paper rather than an allocator blog post. In an OS, paging is invisible to the program because the hardware MMU translates addresses. GPUs have no MMU for this.
Standard attention kernels assume the keys and values for a sequence sit in one contiguous tensor — they index into it arithmetically. Scatter that cache across 40 unrelated blocks and the kernel simply computes garbage.
So PagedAttention required a modified attention kernel that takes the block table as an input and gathers KV from scattered blocks during the attention computation itself. This is the actual technical contribution, and it has a consequence worth stating plainly:
PagedAttention makes attention slightly slower, not faster. Gathering from scattered blocks costs more than reading a contiguous tensor. You accept a small per-step penalty in exchange for fitting several times more sequences — and since throughput scales with batch size far more steeply than it suffers from the gather overhead, you win enormously on net.
Anyone who describes PagedAttention as making attention faster has the mechanism backwards, and will be confused the first time they benchmark it at batch size 1.
Sharing: copy-on-write, straight from fork()
Once the cache is blocks behind a table, two sequences can point at the same physical block. The block keeps a reference count.
This matters immediately for one thing you'll meet in
Sampling Parameters: requesting n=4 completions for one prompt. The
prompt is identical for all four, so all four block tables point at the same prompt blocks. One copy,
not four.
When a sequence needs to write into a block whose refcount is greater than one, it can't — the others are using it. So the block is copied, the writer's table is repointed at the copy, and the original's refcount drops. Copy-on-write, with the same logic as a forked process.
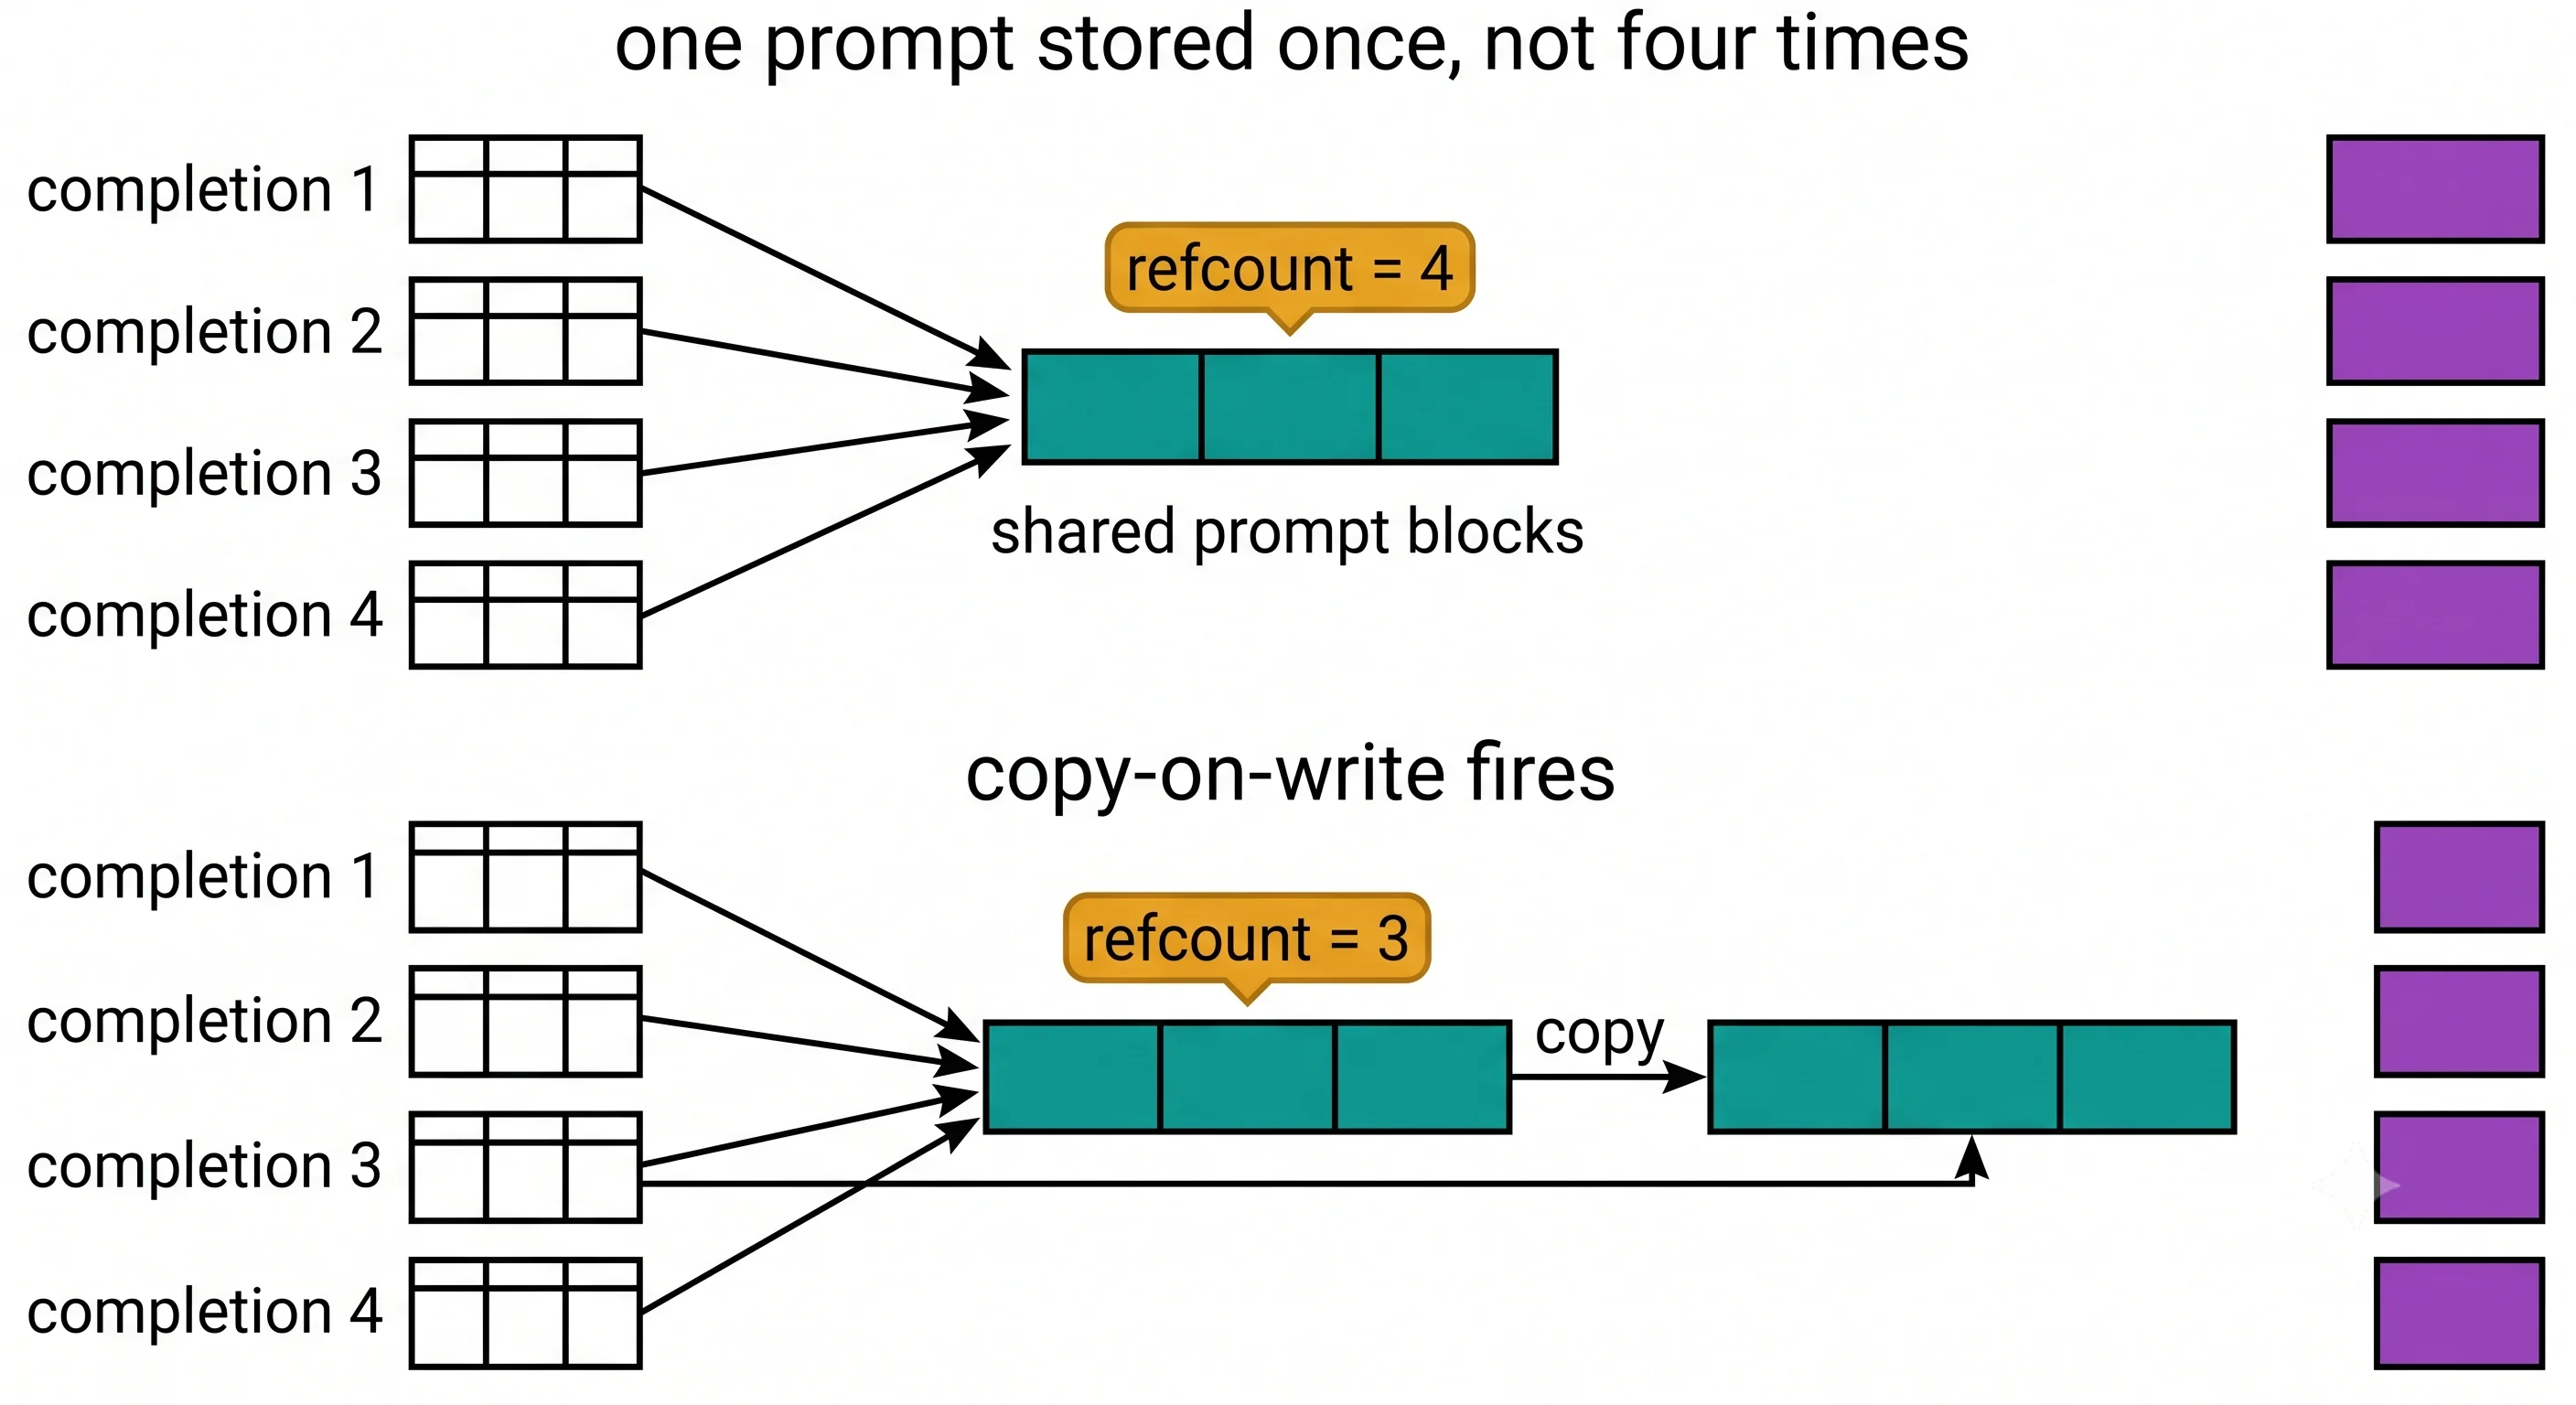
Generalise this from "one request's parallel samples" to "every request that starts with the same system prompt" and you have Prefix Caching, which is the same machinery pointed at a much bigger opportunity.
When the pool runs dry
Blocks are finite. When a running sequence needs a new block and none is free, the scheduler preempts — it takes blocks back from some sequence and recomputes its cache when it resumes. (Older material describes swapping those blocks to CPU RAM instead; that was removed in V1.)
That's a scheduling decision, not an allocator one, so it belongs to The Scheduler & Block Manager. What matters here: preemption is the designed behaviour when the pool is exhausted, not a failure. It shows up in your logs, it costs real work, and it is the signal that you are at capacity.
Try It
Experiment 1 — measure the waste yourself (no GPU)
The claim is that naive allocation wastes 60–80% and paging wastes under 4%. That's simulable in thirty lines, and simulating it makes the mechanism concrete in a way that reading the paper doesn't.
# fragmentation.py — three allocators, one realistic length distribution.
import random
random.seed(0)

MAX_LEN    = 4096      # what a naive allocator must reserve per sequence
BLOCK_SIZE = 16        # vLLM default
N          = 2000

# A realistic mix: most requests are short, a few are long.
lengths = [min(MAX_LEN, int(random.lognormvariate(5.5, 0.9))) for _ in range(N)]
actual  = sum(lengths)

# 1. Naive: reserve max_model_len for every sequence, upfront.
naive = N * MAX_LEN

# 2. Perfect-oracle contiguous: reserve exactly what each sequence needs.
#    Impossible in practice (you don't know the length in advance) — the theoretical floor.
oracle = actual

# 3. Paged: ceil(len / block_size) blocks, so waste is only the last partial block.
paged = sum((-(-l // BLOCK_SIZE)) * BLOCK_SIZE for l in lengths)

print(f"tokens actually stored : {actual:,}")
for name, allocated in [("naive (reserve max)", naive),
                        ("oracle (exact)",      oracle),
                        ("paged (block=16)",    paged)]:
    print(f"{name:<22} allocated {allocated:>12,}  utilisation {actual/allocated:>6.1%}")

print(f"\nmean length {actual/N:.0f} tokens; paged overhead "
      f"{(paged-actual)/N:.1f} wasted slots per sequence (max possible {BLOCK_SIZE-1})")
tokens actually stored : 730,840
naive (reserve max) allocated 8,192,000 utilisation 8.9%
oracle (exact) allocated 730,840 utilisation 100.0%
paged (block=16) allocated 745,632 utilisation 98.0%
mean length 365 tokens; paged overhead 7.4 wasted slots per sequence (max possible 15)What you should observe: paged allocation lands within a few percent of the theoretically perfect oracle — while requiring no knowledge of sequence length in advance, which is the thing the oracle cheats at.
Now change one thing
Set BLOCK_SIZE to 1, then 8, then 32, then 128, and watch paged utilisation:
BLOCK_SIZE |
Utilisation | The catch |
|---|---|---|
| 1 | 100.0% | A block table entry per token. Huge tables, terrible kernel efficiency |
| 8 | 99.0% | One point better than 16, for twice the table entries |
| 16 | 98.0% | The default. Waste already negligible |
| 32 | 96.0% | Fewer table entries, more tail waste |
| 128 | 85.3% | Approaching the naive problem again |
Why 16 is the default becomes obvious from this table plus one fact the simulation can't show: smaller blocks mean more entries to gather in the attention kernel, and GPUs prefer fewer, larger memory transactions. Utilisation is nearly flat between 8 and 32 while kernel efficiency is not — so the default sits where the memory curve has flattened and the kernel still runs well.
Then change MAX_LEN to 32768 and re-run. Naive utilisation collapses from 8.9% to 1.1% — an 8×
fall — while paged stays at 98.0%, completely unmoved. That's the same inverse-proportionality you derived in
Stage 0 — and the demonstration that
PagedAttention is what breaks the link between max_model_len and wasted memory.
Experiment 2 — find your real capacity, and watch sharing work (GPU)
Hardware: Colab T4 or any CUDA GPU.
vllm serve Qwen/Qwen2.5-0.5B-Instruct --max-model-len 4096 2>&1 | tee startup.log
grep -i "blocks" startup.log
The startup log reports the number of GPU blocks allocated. Multiply by 16:
total cacheable tokens = num_gpu_blocks × 16Compare that against the prediction from your Stage 0 capacity script. This is the authoritative number that script was approximating — and reconciling the two teaches you what the overhead term really costs.
Now demonstrate copy-on-write:
# sharing.py — one prompt, four completions. Does memory quadruple?
from vllm import LLM, SamplingParams

llm = LLM(model="Qwen/Qwen2.5-0.5B-Instruct", max_model_len=4096)
prompt = "Write a short poem about paged memory. " * 50     # a long-ish shared prefix

for n in [1, 4]:
    out = llm.generate([prompt], SamplingParams(n=n, max_tokens=128, temperature=0.8))
    print(f"n={n}: {len(out[0].outputs)} completions generated")
    # Watch the KV cache usage % in the engine's log lines while this runs.
What you should observe: going from n=1 to n=4 does not quadruple KV cache usage. The
prompt blocks — the large majority of the memory here — are shared by reference, and only the
divergent generated tokens cost extra. That's copy-on-write, visible in a metric.
⚠️ Log wording, metric names and whether usage is reported per-step vary by version. Read what your build actually prints rather than grepping for the strings above.
Dial It In
| Knob | What it trades | Sane start | Move it when |
|---|---|---|---|
--block-size |
Smaller = less tail waste, larger block tables, less efficient kernel gathers. Larger = the reverse | 16 (default) — leave it | Almost never. If you're tempted, benchmark; the utilisation curve is flat where it matters |
--gpu-memory-utilization |
The size of the block pool itself | 0.9 (default) | Toward 0.95 on a dedicated card; lower when sharing the GPU |
--max-model-len |
With paging, a limit rather than a reservation — but still caps worst-case blocks per sequence | Your measured p99 | Still worth lowering, but for scheduling headroom rather than to reclaim reserved memory |
--enable-prefix-caching |
Extends block sharing from within-request to across-request | On, if requests share prefixes | Prefix Caching |
The honest summary of this section: there is almost nothing to tune here. PagedAttention's defaults are good and the mechanism works without your involvement. That's unusual enough in this article to be worth saying — the tuning that matters happens in the scheduler above it, not the allocator.
Where It Bites You
Thinking PagedAttention makes attention faster. It makes it marginally slower per step and lets you run several times more sequences. The win is memory, spent on batch size. If you benchmark at batch size 1 you'll measure the cost and none of the benefit, and conclude something incorrect.
Tuning --block-size because it's tunable. The utilisation curve is nearly flat from 8 to 32, so
the memory you'd gain is negligible while the kernel efficiency you'd lose is not. This is a knob
that exists for research, and it's a common way to make a server slower while believing you optimised
it.
Expecting sharing you didn't enable. Copy-on-write within a request (n > 1, beam search) is
automatic. Sharing across requests — the far bigger opportunity — is prefix caching, and it's a
separate feature. Assuming your thousand-request-per-minute service with a common system prompt is
already sharing it, when the flag is off, leaves most of the benefit unclaimed.
Treating preemption log lines as errors. Preemption is the designed response to an exhausted block pool. It's a capacity signal — you're at the limit — not a bug. Filing it as an error leads to the wrong fix; reading it as "add a replica or reduce concurrency" leads to the right one.
Assuming ~96% utilisation means ~96% of your GPU does useful work. It means the block pool is
nearly all holding real tokens. Your block pool might itself be badly sized — a max_model_len far
above your traffic still limits concurrency through the scheduler, and gpu_memory_utilization set
low still leaves the card underused. High allocator efficiency inside a small pool is not capacity.
Porting the mental model to another engine. Other engines solve this differently — SGLang's radix tree, TensorRT-LLM's own paged implementation, and approaches like vAttention that use real GPU virtual memory instead. "Everyone does PagedAttention" is close to true in effect and misleading in detail.
In Production
The metric that matters is KV cache utilisation, and it means something specific now. It's the fraction of the block pool currently allocated to live sequences — how full the paged allocator is. Sustained high values mean preemption is imminent; consistently low values mean you sized the pool for traffic that isn't arriving. It is your single best capacity signal, and it leads latency. Observability.
Watch preemption count as a first-class signal, not a log curiosity. A non-zero and rising preemption rate means the block pool is exhausted and the engine is doing work it will have to throw away — recomputing evicted sequences. Throughput degrades non-linearly once this starts, so it's the metric that should page you before latency does.
Capacity is now honestly expressible. Because paging removed the reservation waste, your capacity
statement is clean: num_gpu_blocks × block_size total cacheable tokens, shared across all live
requests, minus a few percent tail waste. That's a number you can put in a capacity plan and defend —
which was not true of pre-paging systems, where the answer depended on the length distribution of
requests you hadn't received yet.
What changes at 10× traffic. Nothing about the allocator; it's already near-optimal and doesn't degrade with load. What changes is that you hit the pool's edge, and the behaviour there is preemption rather than a graceful slowdown. So the operational consequence of PagedAttention is that your capacity cliff is sharper and more predictable than it used to be — better for planning, unforgiving if you don't alert on it.
The long-context tenant, again. Paging means a 100k-token request consumes 6,250 blocks progressively rather than reserving them upfront, which is strictly better. It does not stop that request from eventually consuming a large fraction of the pool and preempting dozens of others. Fairness is a scheduler concern; the allocator is neutral.
Check Yourself
Recall the idea
What OS concept is PagedAttention borrowed from, and what maps to what?
Virtual memory with paging. OS page → KV block (16 tokens by default); page table → per-sequence
block table; process → sequence; fork() with copy-on-write → block sharing with reference counts;
and the OS's swap-to-disk has no V1 equivalent — vLLM recomputes an evicted sequence instead of
swapping it out. The shared illusion is that a sequence sees a contiguous cache while the physical
blocks are scattered.
Name the three kinds of waste in a contiguous KV cache, and say which PagedAttention eliminates.
Over-reservation (allocating max_model_len upfront because tensors can't grow) — eliminated, since
blocks are allocated on demand. External fragmentation (free memory that isn't contiguous) —
eliminated structurally, because all blocks are the same size so any free block fits. Internal
fragmentation (the partial tail) — not eliminated, but bounded to at most block_size − 1 tokens per
sequence, which is a few percent.
Why is 16 the default block size?
Because utilisation is already ~97% at 16 and barely improves below it, while smaller blocks mean more block-table entries and less efficient gathers in the attention kernel. It sits where the memory curve has flattened and kernel efficiency is still good.
Does PagedAttention make attention faster?
No — slightly slower per step, because gathering KV from scattered blocks costs more than reading a contiguous tensor. It buys memory, which buys batch size, which buys throughput. The net win is large; the mechanism is not "faster attention".
Explain the mechanics
Why couldn't you just use a standard attention kernel with paged storage?
Because standard kernels assume the KV for a sequence is one contiguous tensor and index into it arithmetically. There's no MMU doing address translation for them, so scattered blocks produce wrong results. PagedAttention's actual technical contribution is a kernel that accepts the block table and gathers from non-contiguous blocks during attention.
Walk through what happens when a sequence generates its 17th token with block_size=16.
The first 16 tokens filled logical block 0. Token 17 needs logical block 1, which doesn't exist yet, so the block manager takes a free physical block from the pool and appends the mapping to this sequence's block table. Tokens 18–32 need no further allocation. If no free block exists, the scheduler preempts a sequence to reclaim blocks.
Explain copy-on-write in this context and give a case where it fires.
Multiple sequences can map the same physical block, tracked by a reference count — used when one
prompt produces several completions (n > 1, beam search), so the prompt blocks are stored once. When
a sequence needs to write into a block with refcount > 1, it copies the block, repoints its own table
entry at the copy, and decrements the original's count. It fires the moment two shared sequences
diverge — the first token where their generations differ and both need to write into the same
partially-filled block.
Derive the worst-case internal fragmentation and explain why it's acceptable.
A sequence of length L uses ceil(L / block_size) blocks, wasting block_size × ceil(L/block_size) − L slots, which is at most block_size − 1 = 15. That's a fixed cost per sequence regardless of
length, so as a fraction it shrinks as sequences get longer — about 2% at 500 tokens. Fixed overhead
against a growing denominator is why "under 4% waste" holds.
Reason about a trade-off
A colleague proposes --block-size 4 to cut waste. Respond.
Take the memory argument seriously and then show it's already won: utilisation at 16 is ~97%, so the absolute best case is a ~3% gain. Against that, you quadruple the number of block-table entries and force the attention kernel into four times as many small, scattered gathers, which GPUs handle poorly. You'd likely lose more throughput to kernel inefficiency than you'd gain in capacity. The principled response: this is measurable, so benchmark it — but the prior is strongly against, and the default exists because this curve has been explored.
Your server was sized for 250 concurrent requests and manages 200 with frequent preemption. Is the allocator at fault?
Almost certainly not — paging is near-optimal and the ~3% tail waste can't explain a 20% shortfall.
More likely: the overhead term in your estimate (activations, CUDA graphs, framework) was
underestimated, so the block pool is smaller than predicted; your real sequences are longer than the
4,096 you assumed; or max_num_seqs is capping you below the memory limit. Check the actual
num_gpu_blocks from the startup log against your prediction first — that reconciliation identifies
which of the three it is.
When would you not want paged KV cache?
When there's no memory pressure to relieve and you'd rather have the kernel's contiguous-read speed: a single sequence, fixed length, batch of one, on hardware with memory to spare — an embedded or single-user deployment. That's precisely the llama.cpp territory from Where vLLM Sits. It's also worth knowing that alternatives exist which keep contiguity while getting on-demand growth by using the GPU's own virtual memory support, trading kernel compatibility for a different set of constraints.
Explain to a manager why PagedAttention is worth 2–4× throughput without using the word "paging".
Before it, the system had to guess how long each answer would be and set aside enough memory for the longest possible one — so most of the reserved memory sat empty, and the machine could only hold a fraction of the users it had memory for. vLLM hands out memory in small pieces as each answer actually grows, so almost none is wasted, and the same GPU holds several times more conversations at once. More conversations at once is more throughput, on hardware you already own.
Cheat Sheet
The mapping
| OS | vLLM |
|---|---|
| Page | KV block (16 tokens default) |
| Page table | Block table (per sequence) |
| Process | Sequence / request |
fork() + copy-on-write |
Block sharing + refcounts |
| Swap to disk | (none — V1 recomputes instead) |
The numbers
| Number | Meaning |
|---|---|
| 16 | Default block_size, in tokens |
| 20–40% | KV memory utilisation in pre-paging systems |
| ~96% | KV memory utilisation with PagedAttention |
block_size − 1 = 15 |
Worst-case wasted token slots per sequence, ever |
num_gpu_blocks × 16 |
Your total cacheable tokens — from the startup log |
What it fixes
| Waste | Fixed? | How |
|---|---|---|
Over-reservation to max_model_len |
✅ Eliminated | Blocks allocated on demand |
| External fragmentation | ✅ Eliminated | Uniform block size — any free block fits |
| Internal fragmentation | ⚠️ Bounded | Only the last block, ≤15 slots |
| Attention kernel speed | ❌ Slightly worse | Gathering scattered blocks costs more than a contiguous read |
Flags
--block-size 16               # leave it alone
--gpu-memory-utilization 0.9  # sizes the block pool
--enable-prefix-caching       # extends sharing across requests
The one thing to remember
PagedAttention doesn't speed up attention. It stops you wasting 60–80% of your KV cache, and you spend the reclaimed memory on a bigger batch. The throughput comes from the batch.
Sources
- Kwon et al., Efficient Memory Management for Large Language Model Serving with PagedAttention, SOSP 2023 — arxiv.org/abs/2309.06180
- vLLM optimisation and tuning docs — docs.vllm.ai/en/stable/configuration/optimization/
- Prabhu et al., vAttention: Dynamic Memory Management for Serving LLMs without PagedAttention — arxiv.org/abs/2405.04437 (the alternative approach referenced in Where It Bites You)
← Previous: Prefill vs Decode · Next: Continuous Batching →
⚠️ Verification checklist (delete before publishing)
Paper figures
- The 20–40% utilisation range for pre-vLLM systems and ~96% for vLLM. Confirm both against the SOSP paper directly — currently sourced from secondary summaries, one of which cites 20.4% for a specific Orca configuration. Quote the paper's own framing and name the baseline.
- The 60–80% waste figure used in the opening — reconcile it with the 20–40% utilisation figure so the page isn't quoting the same measurement two ways with different numbers.
Defaults and behaviour
-
block_sizedefault of 16 — confirm for the pinned version. Some backends and hardware override it, and V1 may differ; check whether it's still user-settable via--block-size. - Confirm the startup log still reports a GPU-blocks count and capture its exact wording — the Try It grep depends on it.
- Resolved: GPU↔CPU KV cache swapping was REMOVED in V1 ("vLLM V1 no longer requires KV
cache swapping to handle request preemptions"). All swap references on this page are corrected
and
--swap-spaceis dropped from the flag list. - Confirm copy-on-write block sharing for
n > 1is active by default and not gated behind prefix caching. Thesharing.pyexperiment fails if it is. - Confirm whether prefix caching is on by default in the pinned version — this page says sharing across requests needs a flag, and Stage 0 page 1 says prefix caching is on by default. These two statements may contradict each other; reconcile.
Technical claims
- "PagedAttention makes attention slightly slower per step." This is asserted confidently and is central to the page's framing. Find a source or a measurement, or soften to "does not make attention faster".
- The one-block ≈ 192 KB figure for Qwen2.5-0.5B (12 KB/token × 16). Arithmetic is right if the 12 KB/token figure holds — that one is verified.
- Confirm the claim that external fragmentation is eliminated structurally holds given any variable-size allocations elsewhere in the engine.
Code
-
fragmentation.pyhas been run. Output block replaced with real values. The lognormal (5.5, 0.9) gives a mean of 365 tokens, not the ~264 originally guessed. Still worth swapping in a distribution measured from real logs before publishing, but the figures are now genuine. -
BLOCK_SIZEsweep table now carries measured values (100.0 / 99.0 / 98.0 / 96.0 / 85.3%). The originally guessed figures were each 1–5 points optimistic. - Run
sharing.pyand confirm KV cache usage really does not scale linearly withn. Capture the actual usage figures — this is the page's only direct empirical demonstration of copy-on-write.
Rendering
- Two images generated and placed; rows added to
image-prompts.md. - The ASCII block-table listing renders correctly on the published site.
- All relative links resolve once target files exist.