
02 · Prefill vs Decode
Generating text is two different computations wearing the same coat. They use identical weights, run in the same process, and have almost nothing else in common: one is limited by how fast your GPU can multiply, the other by how fast it can read its own memory. Batching transforms one and barely touches the other.
Nearly every confusing performance result in LLM serving — a benchmark that looks nothing like production, a "fast" server users call slow, one long prompt stalling everybody — is these two phases being measured or scheduled as if they were one thing.
The Problem
Symptoms that all have this single cause:
- Your benchmark says 3,000 tokens/sec and users say it's slow. Both are true. You measured aggregate throughput; they experienced their own token rate, and those numbers move in opposite directions as load rises.
- A 200-token prompt answers instantly; a 20,000-token prompt takes eight seconds before the first word appears — then streams at exactly the same speed. Something scales with prompt length and something doesn't, and they're not the same something.
- One user pastes a long document and everyone else's output stutters. Not slower to start — visibly jerky mid-stream, for users whose own requests are tiny.
- You upgrade to a GPU with twice the FLOPs and per-user speed barely moves. The number you paid for wasn't the number you were limited by.
- Your RAG service is slow in a way your chatbot isn't, on the same hardware and model, and the usual tuning advice does nothing.
The missing distinction:
| Prefill | Decode | |
|---|---|---|
| What it does | Processes the entire prompt | Generates output, one token at a time |
| How many forward passes | One, over all prompt tokens | One per output token, in sequence |
| Parallel? | Fully — all prompt tokens at once | Not at all — token n needs token n−1 |
| Limited by | GPU arithmetic | GPU memory bandwidth |
| Cost scales with | Prompt length | Output length × how long each step takes |
| Determines | TTFT — how long until the first word | ITL — how fast it types |
| Helped by batching? | Barely | Enormously |
Two phases, two bottlenecks, two metrics, two responses to the same tuning lever. Collapsing them into "tokens per second" throws away the information you need.
The Idea
Prefill is reading the question. Decode is writing the answer.
Reading is parallel. Handed a ten-page brief, your eyes take in a line at a time, and you can skim the whole thing in a couple of minutes — the work scales with how much there is, but you're never blocked waiting on yourself. Twice the pages, roughly twice the reading time.
Writing is stubbornly serial. You cannot write the ninth word of a sentence before the eighth, because what you write next depends on what you just wrote. And here's the part that matters: your writing speed doesn't depend on how long the brief was. A 500-word reply takes about the same time whether you read one page or ten.
That gives you the whole model:
- Long prompt, short answer — a long read, a quick note. Most of the time is before the first word appears. Document summarisation, classification, RAG.
- Short prompt, long answer — a glance, then an essay. First word comes fast, then you're watching it type. Creative writing, code generation, reasoning.
- Both long — slow to start and slow to finish. Long-context agents.
And one more, which is the source of the "everyone else stutters" symptom. If a single person in the room must do all the reading and all the writing for everyone, then whenever they stop to read somebody's ten-page brief, every other reply pauses mid-sentence. Not delayed at the start — paused in the middle. That's a scheduling problem rather than a speed problem, and it has a specific fix we'll come to.
Under the Hood
Why one is compute-bound and the other isn't
Both phases multiply the same weights. The difference is how much work they extract per byte read out of GPU memory.
Prefill processes, say, 2,000 prompt tokens in one pass. It reads each weight once and uses it 2,000 times — every token in the prompt goes through the same matrices, so those become large matrix-matrix multiplications. GPUs are extraordinarily good at that. The tensor cores saturate, and the read cost is amortised across thousands of tokens.
Decode produces one token per sequence per step. It reads every weight in the model — gigabytes — and does a handful of arithmetic per weight. The matrices degenerate into matrix-vector products. The GPU spends its time waiting on memory, and its arithmetic units are largely idle.
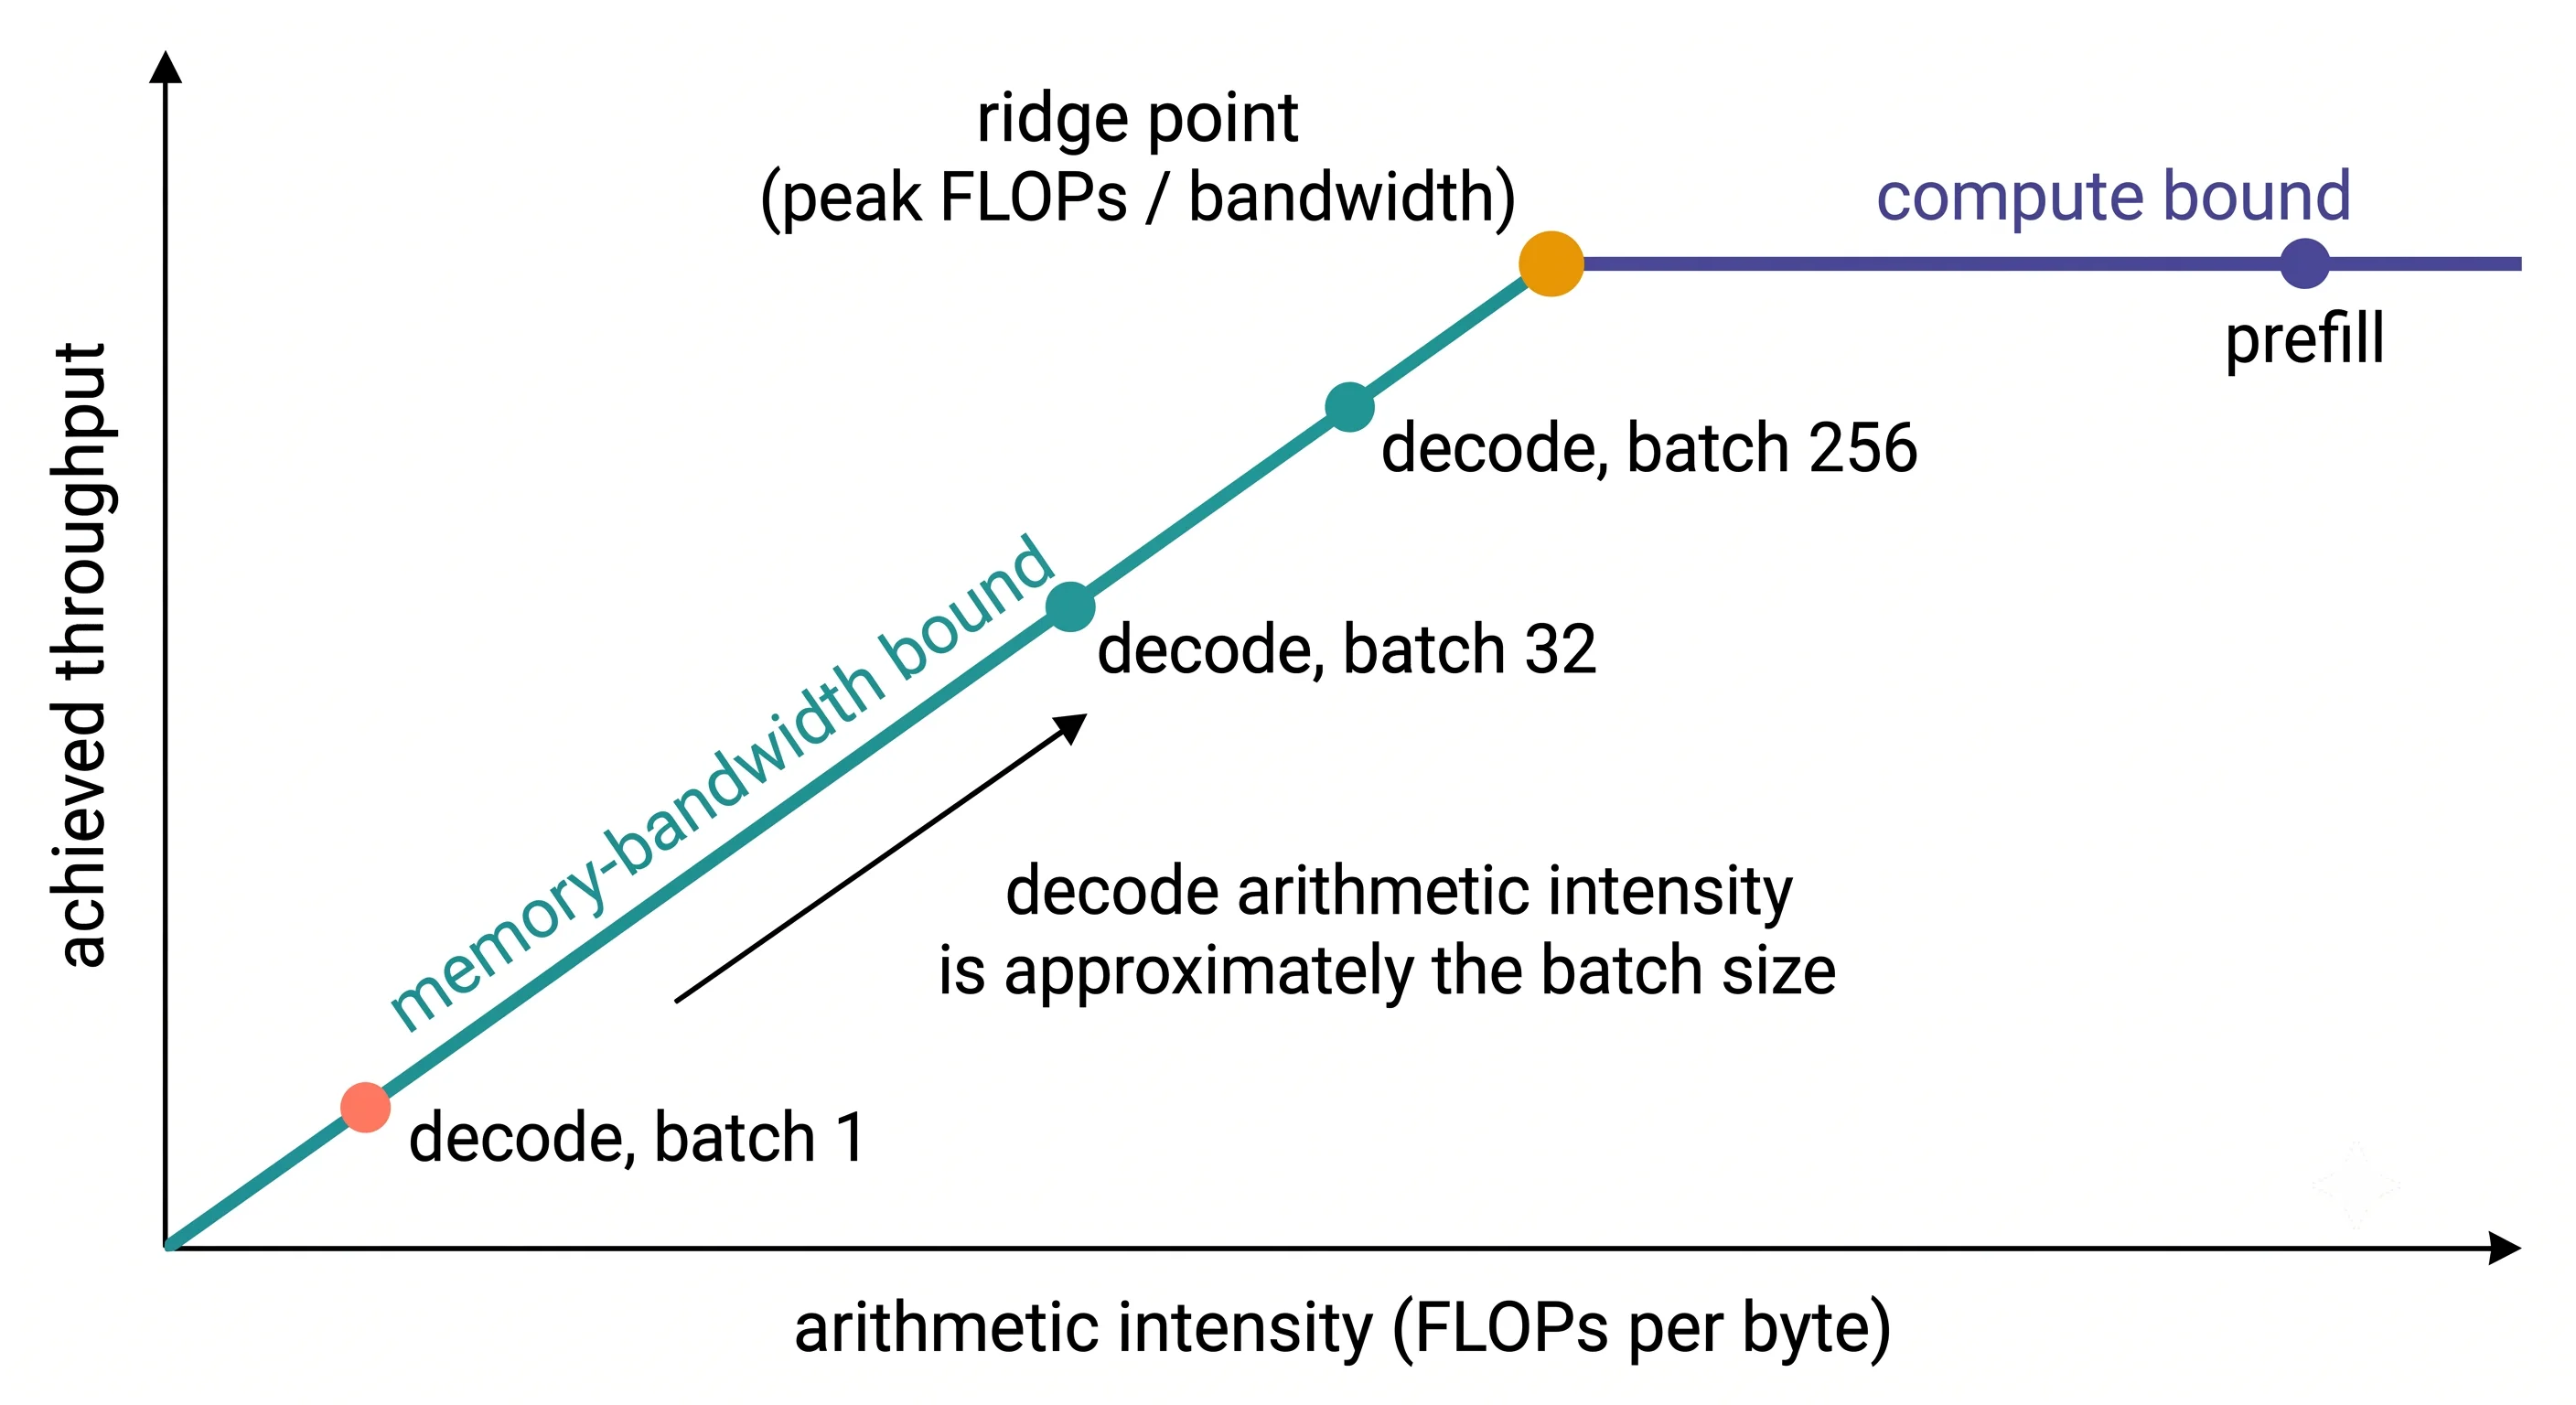
The formal name for the deciding quantity is arithmetic intensity: FLOPs performed per byte read from memory. Compare it against your hardware's ratio of peak FLOPs to memory bandwidth — the ridge point — and you know which resource you're actually limited by.
ridge point = peak FLOPs ÷ memory bandwidth

  T4    ~65 TFLOP/s fp16  ÷  320 GB/s   ≈ 203 FLOPs per byte
  A100  ~312 TFLOP/s bf16 ÷  2039 GB/s  ≈ 153 FLOPs per byte
  H100  ~990 TFLOP/s bf16 ÷  3350 GB/s  ≈ 295 FLOPs per byte
Now the result worth memorising. In decode, each weight is read once (2 bytes in fp16) and used for one multiply-add (2 FLOPs) per sequence in the batch. So:
Decode arithmetic intensity ≈ batch size.
Batch of 1 on a T4 gives you an intensity of about 1 against a ridge point of ~203 — you are using roughly half a percent of the GPU's arithmetic capability. To become compute-bound you need a batch in the low hundreds.
That single line explains an enormous amount:
- Why batch-1 decode wastes the machine, and why no kernel optimisation rescues it.
- Why throughput scales almost linearly with batch size for a long way — you're climbing the bandwidth-bound ramp, getting extra tokens for free.
- Why it eventually flattens: you reach the ridge point and become compute-bound like prefill.
- Why vLLM's scheduler defaults permit large batches — hundreds to thousands of concurrent sequences
and thousands of batched tokens per step, chosen to get you up that ramp. The exact defaults are
platform- and version-dependent, so read yours from
vllm serve --helprather than trusting any article's number, including this one. - Why a GPU with more FLOPs but similar bandwidth barely improves per-user speed. You were never limited by FLOPs.
The metrics, defined precisely
request arrives
   │
   ├── queued, waiting for a slot ────────────┐
   │                                          ├──►  TTFT  (time to first token)
   ├── PREFILL: one pass over the prompt ─────┘
   │
   ├── first token emitted
   │
   ├── DECODE step ──► token 2   ┐
   ├── DECODE step ──► token 3   ├──► ITL (inter-token latency), one gap each
   ├── ...                       │
   └── DECODE step ──► token N   ┘

end-to-end latency = TTFT + (N − 1) × ITL| Metric | Full name | What it is | Driven by |
|---|---|---|---|
| TTFT | Time to first token | Arrival → first token | Queue time + prompt length |
| ITL | Inter-token latency | Gap between consecutive tokens | Batch size, model size, bandwidth |
| TPOT | Time per output token | Usually a synonym for ITL; sometimes the average including prefill — ask which | As above |
| E2E | End-to-end latency | Arrival → last token | Both, plus output length |
Users perceive TTFT as responsiveness and ITL as speed. They are different complaints with different fixes, and a service can be excellent at one and terrible at the other.
The critical asymmetry, which is the single most useful thing on this page:
| Longer prompts | More concurrent users | |
|---|---|---|
| TTFT | ⬆️ rises roughly linearly | ⬆️ rises (queueing) |
| ITL | ➡️ essentially unchanged | ⬆️ rises |
| Throughput | ➡️ roughly unchanged | ⬆️ rises a lot |
Prompt length and concurrency are close to independent knobs on your latency profile, and you can verify that yourself in Try It.
How they interfere — and why chunked prefill exists
A GPU runs one thing at a time. Prefill for a 20,000-token prompt is a large, indivisible-looking chunk of work; while it runs, no decode step runs. Every user currently streaming gets nothing — mid-sentence — until it finishes.
That's the "one user pastes a document and everyone stutters" symptom. It isn't contention for memory; it's the scheduler having handed the whole GPU to one enormous prefill.
The fix is chunked prefill: split a long prefill into pieces and interleave them with decode steps, so each scheduler step does a bit of prefill and keeps the decode batch moving.
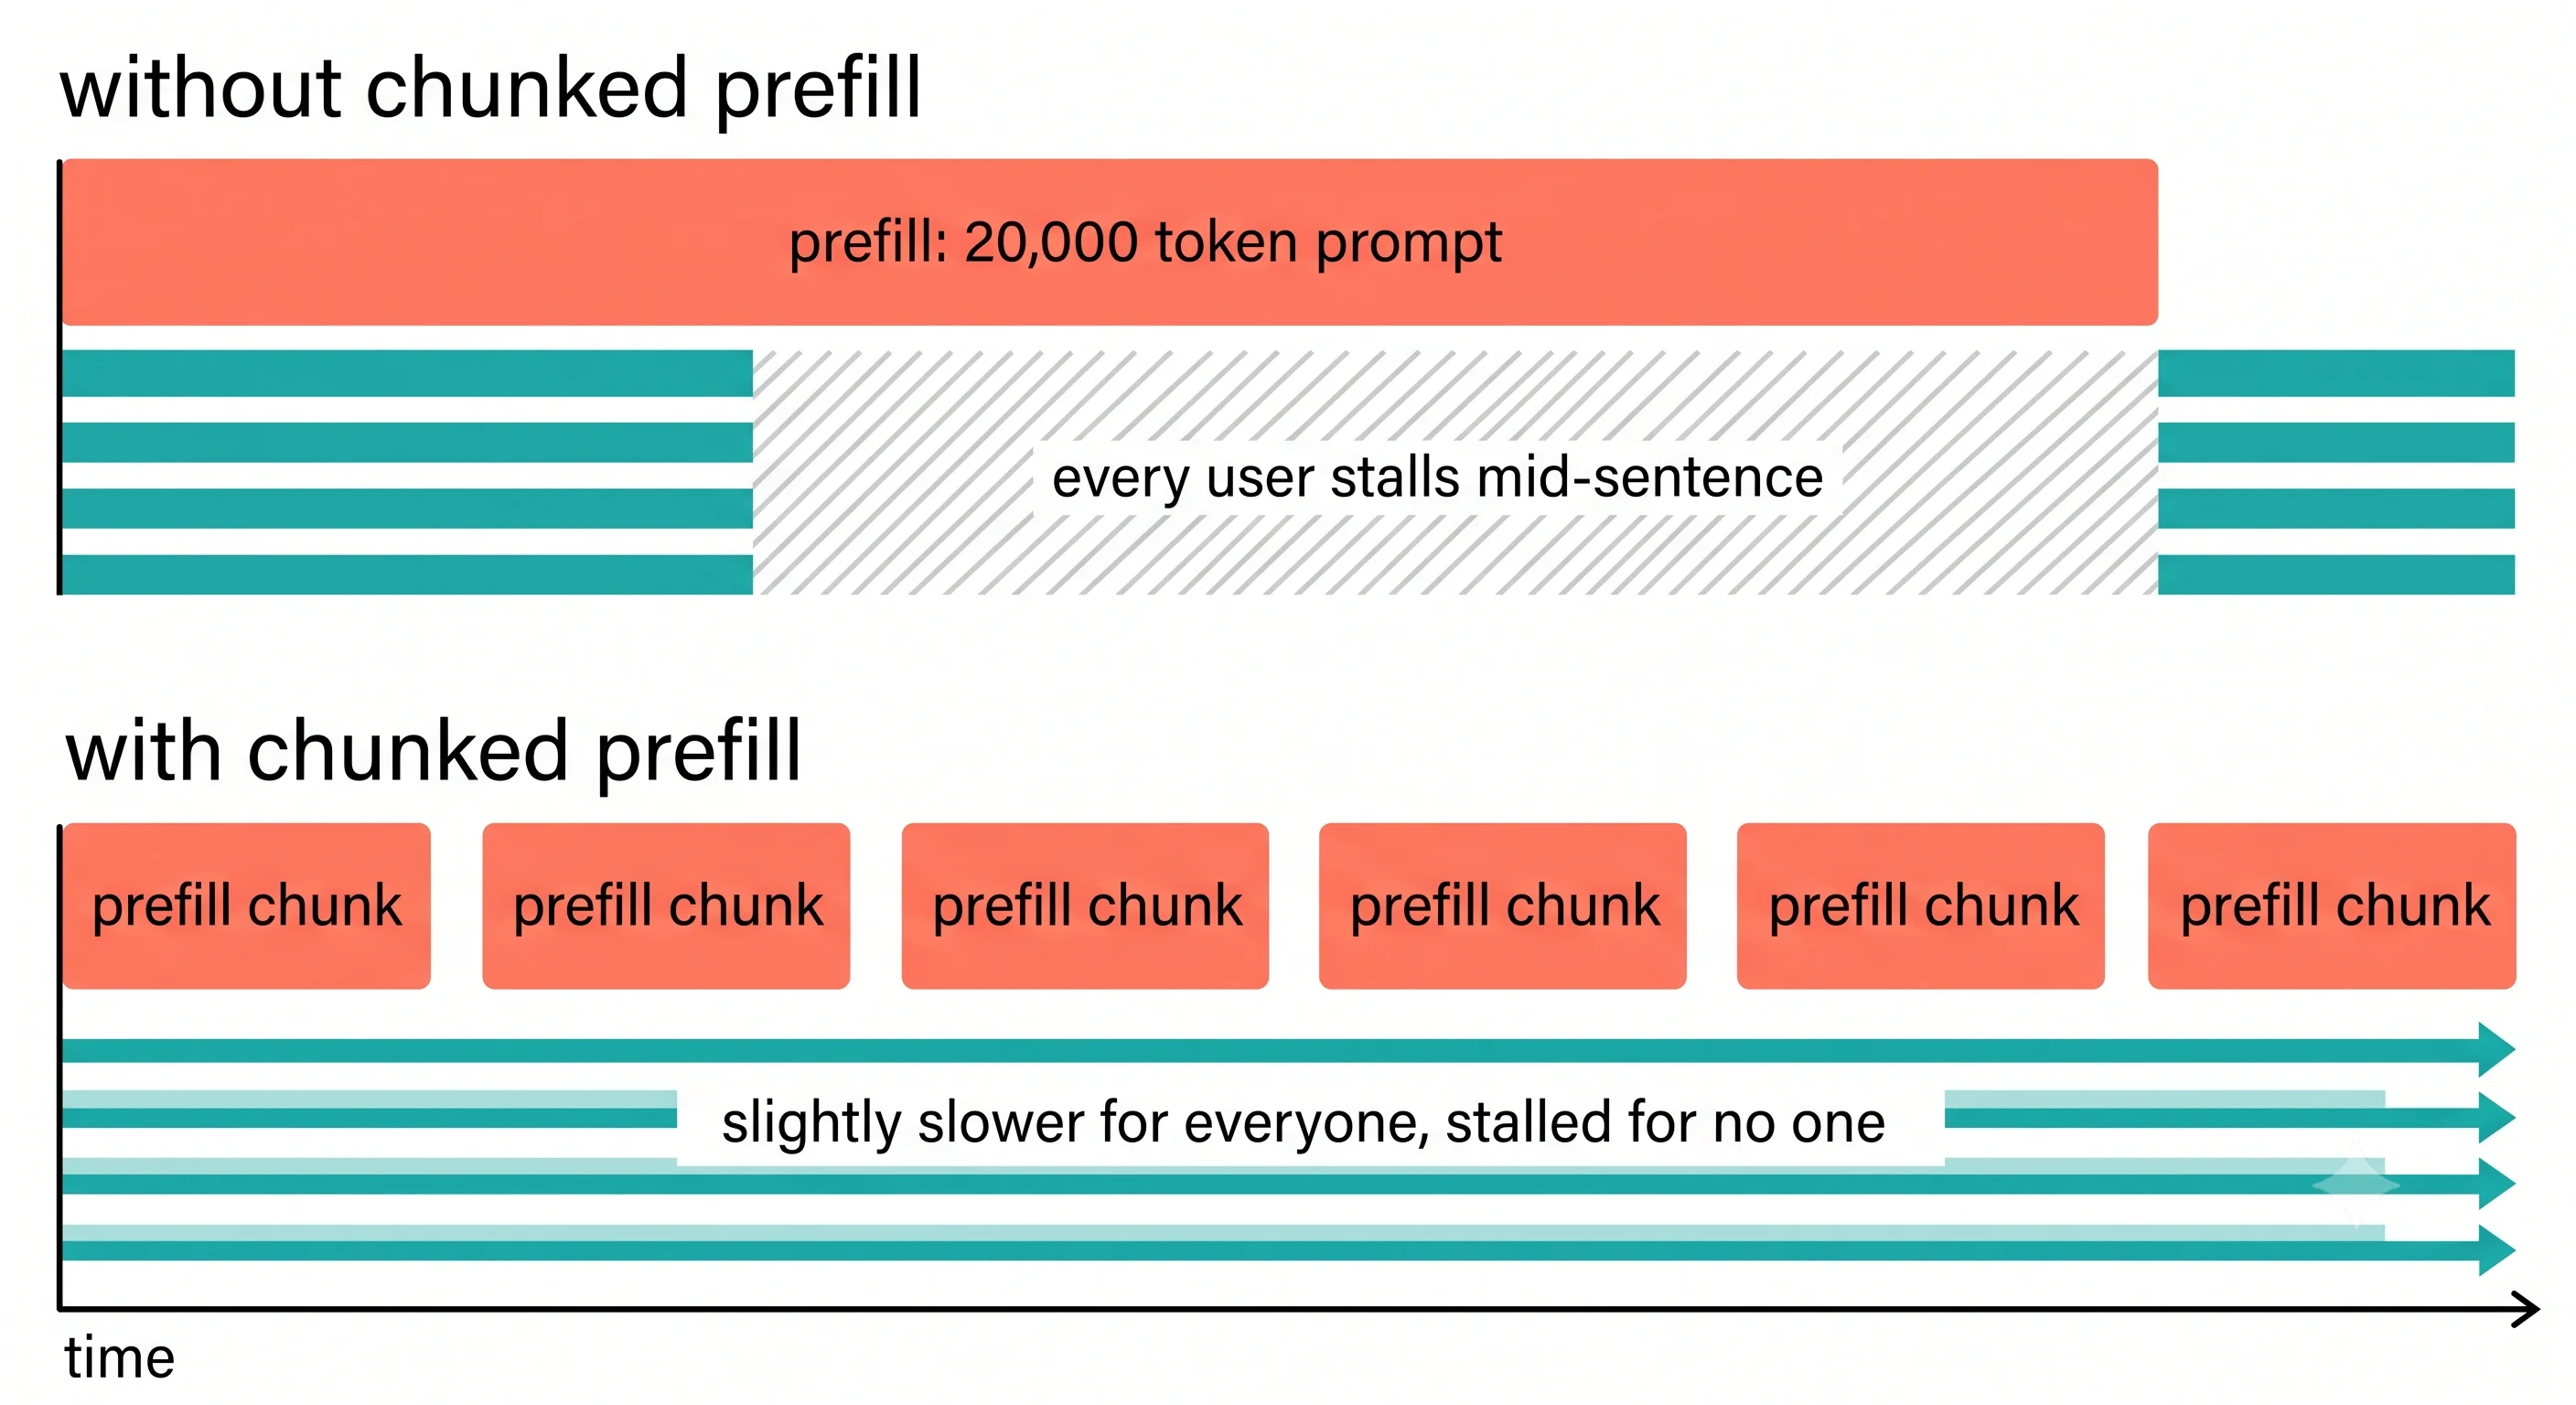
The trade-off is explicit: the long prompt's own TTFT gets slightly worse, because its prefill is now spread across several steps competing with decode. Everyone else's ITL gets dramatically better. That's a deliberate choice to protect the many from the one.
In current vLLM this is on by default, which is why you may never see the pathological version — but you need to know it exists, because the tuning knobs in Long Context & Chunked Prefill are all about where to set that dial. ⚠️ Verify the default for your version.
Try It
Hardware: a running vLLM server. Free Colab T4 is fine with Qwen2.5-0.5B-Instruct. Start it
with:
vllm serve Qwen/Qwen2.5-0.5B-Instruct --max-model-len 8192The point of this experiment is to stop measuring "tokens per second" and start measuring TTFT and ITL separately — at which point the two phases become visible as distinct things.
The measurement harness
# ttft_itl.py — measure TTFT and ITL separately from a streaming response.
import time, statistics
from openai import OpenAI

client = OpenAI(base_url="http://localhost:8000/v1", api_key="EMPTY")
MODEL = "Qwen/Qwen2.5-0.5B-Instruct"

def measure(prompt_tokens: int, max_tokens: int = 128):
    prompt = "word " * prompt_tokens              # crude but consistent across runs
    t0 = time.perf_counter()
    ttft, stamps = None, []
    stream = client.completions.create(
        model=MODEL, prompt=prompt, max_tokens=max_tokens,
        temperature=0.0, stream=True,
    )
    for chunk in stream:
        if not chunk.choices[0].text:
            continue
        now = time.perf_counter()
        if ttft is None:
            ttft = now - t0                        # prefill (+ any queueing) ends here
        stamps.append(now)

    gaps = [b - a for a, b in zip(stamps, stamps[1:])]   # each gap is one decode step
    return ttft, statistics.median(gaps) if gaps else float("nan")

print(f"{'prompt tokens':>14} {'TTFT (ms)':>10} {'ITL (ms)':>9}")
for n in [64, 256, 1024, 4096]:
    ttft, itl = measure(n)
    print(f"{n:>14} {ttft*1000:>10.0f} {itl*1000:>9.1f}")
# UNVERIFIED — needs a Colab T4 run. See docs/VERIFICATION.md, session 1 item 3.
# Indicative shape only; TTFT rising while ITL stays flat is the point.
prompt tokens TTFT (ms) ITL (ms)
64 41 9.8
256 58 9.7
1024 119 9.9
4096 372 9.8What you should observe: TTFT climbs roughly with prompt length. ITL does not move.
That's the two phases, separated, on your own hardware. Prefill is doing more work as the prompt grows; each decode step is doing exactly the same work regardless — one token, all the weights.
Now change the other knob
Hold the prompt fixed and add concurrency instead:
# concurrency.py — same measurement, but N requests at once.
import concurrent.futures as cf, statistics
from ttft_itl import measure          # reuse the harness above

for n_concurrent in [1, 4, 16, 64]:
    with cf.ThreadPoolExecutor(max_workers=n_concurrent) as ex:
        results = list(ex.map(lambda _: measure(256, 128), range(n_concurrent)))
    ttfts = [r[0] for r in results]
    itls  = [r[1] for r in results]
    # aggregate token rate across all streams
    tput = n_concurrent * 128 / (statistics.median(ttfts) + 127 * statistics.median(itls))
    print(f"concurrency {n_concurrent:>3}  "
          f"TTFT {statistics.median(ttfts)*1000:>6.0f} ms  "
          f"ITL {statistics.median(itls)*1000:>5.1f} ms  "
          f"throughput {tput:>7.0f} tok/s")
What you should observe, and what each observation means:
| Observation | Interpretation |
|---|---|
| ITL rises as concurrency rises — but far less than proportionally | You're climbing the bandwidth-bound ramp. Extra sequences are nearly free because the weight read is shared |
| Aggregate throughput rises steeply | Same fact from the other side. This is the entire economic case for an inference server |
| TTFT rises too, and eventually faster than ITL | Queueing. Requests are waiting for a scheduler slot before prefill even starts |
| Past some concurrency, throughput flattens while ITL keeps climbing | You've hit the ridge point (compute-bound) or run out of KV cache. Reading Logs & Metrics tells them apart |
Put the two experiments together and you have the deliverable: prompt length moves TTFT, and concurrency moves ITL and throughput. Two independent dials. Any tuning conversation that doesn't distinguish them is guesswork.
One more, if you have ten minutes
Run one client streaming a short prompt continuously while a second client submits a single 8,000-token prompt. Watch the first client's ITL during the big prefill.
What you should observe: a bump, but a modest one — because chunked prefill is interleaving them. If you can disable chunked prefill on your version, do so and re-run: the bump becomes a stall. That difference is the feature, made visible.
Dial It In
| Knob | What it trades | Sane start | Move it when |
|---|---|---|---|
--max-num-batched-tokens |
Tokens per scheduler step. Larger = better prefill efficiency and throughput; smaller = smoother ITL for everyone | Leave at the default until you've measured | ITL is spiky under long prompts → lower it. Prefill-heavy batch work → raise it |
--max-num-seqs |
Ceiling on concurrent sequences, so a ceiling on decode batch size | Your build's default — check vllm serve --help |
Lower it to protect ITL under load; raising it only helps if KV cache allows |
--enable-chunked-prefill |
Long prefills interleave with decode instead of blocking it | On (the default in current versions) | Turning it off is almost always wrong for interactive serving |
--max-model-len |
Bounds the largest prefill you can be asked to do | Your measured p99 | It also caps KV cache per sequence — see The KV Cache |
| Model / GPU choice | Bandwidth improves ITL; FLOPs improve prefill | Match to your phase mix | Prefill-heavy (RAG) → FLOPs. Decode-heavy (chat) → bandwidth |
The rule of thumb: if your complaint is TTFT, look at prompt length, queueing and prefill capacity. If your complaint is ITL, look at batch size, model size and memory bandwidth. Applying a TTFT fix to an ITL problem is the most common wasted tuning cycle in this domain.
Where It Bites You
Reporting a single "tokens per second". It silently mixes prefill and decode tokens, which cost wildly different amounts, and it hides whether you mean per-user or aggregate. A server doing 3,000 tok/s aggregate across 64 users is giving each of them ~47 tok/s; the same 3,000 for one user is impossible. Always report TTFT and ITL, at a stated concurrency.
Benchmarking with short prompts and long outputs when production is the reverse. This is the single most misleading benchmark shape, and it's the default in most quickstarts. A RAG service with 4,000-token prompts and 100-token answers is prefill-dominated — an almost entirely different machine from what a 50-token-prompt benchmark measured.
Buying FLOPs to fix a decode problem. Decode is bandwidth-bound. A card with substantially more compute but similar memory bandwidth will barely change ITL, and you will have spent a lot to discover which side of the ridge point you were on. Check the ratio before the purchase order.
Assuming a bigger batch is always better. It raises throughput and it raises everyone's ITL. If you have a per-user speed target, batch size is bounded by that target, not by what maximises tokens/sec. This is the throughput-versus-latency trade-off from Stage 0, now with a mechanism attached.
Measuring TTFT on an idle server. On an idle server TTFT is nearly pure prefill. Under load it's mostly queueing, and the two have completely different fixes — more prefill capacity versus more replicas. A TTFT number without a concurrency number is not a measurement.
Confusing TPOT with ITL. Some tools define TPOT as end-to-end latency divided by output tokens, which folds prefill into a per-token number and makes long prompts look like slow generation. Others use it as a synonym for ITL. Always ask which, especially when comparing two vendors' figures.
Forgetting that prompt tokens are usually cheaper and more numerous. Per token, prefill is far more efficient than decode. But a RAG workload can have fifty times more prompt tokens than output tokens, so prefill still dominates the bill. Cost-per-token models that use one rate for both are wrong in a direction that depends on your workload — Cost per Token.
In Production
Set two SLOs, not one. TTFT and ITL fail independently and have different fixes, so a single latency target hides which one is broken. A workable pair for interactive chat: p95 TTFT under some hundreds of milliseconds, and p95 ITL low enough to sustain ~20–30 tokens/sec per user, which is the rate that reads as comfortably fast. Batch jobs invert this entirely — they should have a throughput SLO and essentially no latency SLO.
Know your phase mix, and put it in your capacity model. The ratio of prompt tokens to output tokens across your real traffic decides which resource you're buying. Summarisation and RAG are prefill-heavy and want compute; chat and code generation are decode-heavy and want bandwidth. The same GPU is a good deal for one and a poor deal for the other, and the workload script from Stage 0 already gives you the ratio.
Alert on TTFT and ITL separately, and read them as a pair. Rising TTFT with flat ITL means queueing — you need more replicas. Rising ITL with flat TTFT means the decode batch has grown — you are near a throughput/latency boundary and may need to cap concurrency. Both rising means you're simply out of capacity. That three-way diagnosis is impossible from one blended latency metric, and it's most of what an on-call engineer needs.
What changes at 10× traffic. ITL degrades gracefully at first, as batches fill and each user pays a little. TTFT degrades sharply, because it absorbs queueing, which grows non-linearly once arrival rate approaches service rate. So the first thing users notice at scale is almost always slow starts, not slow typing — and it's a signal to scale out rather than to tune.
The frontier worth knowing about. Because the two phases want different hardware, some large deployments now run prefill/decode disaggregation — separate pools of GPUs, each specialised, with KV cache transferred between them. It's genuinely useful at large scale and clearly overkill below it, but it's the logical conclusion of everything on this page, and it's why this distinction is worth internalising rather than memorising.
Check Yourself
Recall the idea
Describe prefill and decode in one sentence each.
Prefill is a single forward pass over the entire prompt, processing all its tokens in parallel to produce their KV cache entries and the first output token. Decode is one forward pass per subsequent output token, each depending on the previous, generating one token per sequence per step.
Which phase determines TTFT, and which determines ITL?
Prefill (plus any queueing) determines TTFT. Decode determines ITL. That's why they respond to different fixes.
Why does a longer prompt increase TTFT but not ITL?
Prefill work scales with prompt length, so a longer prompt takes longer before the first token appears. Each decode step then does the same work regardless of prompt length — read all the weights, produce one token — so the gap between tokens is unchanged. Attention over a longer cache does add a little, but it's small next to the weight read.
Why does batching help decode far more than prefill?
Prefill is already compute-bound: it extracts thousands of operations per byte read, so the GPU's arithmetic units are saturated and there's little idle capacity to fill. Decode is memory-bandwidth-bound at small batch sizes, so additional sequences ride along on a weight read that was already paid for — nearly free throughput until you reach the ridge point.
Explain the mechanics
Define arithmetic intensity and the ridge point, and state decode's intensity.
Arithmetic intensity is FLOPs performed per byte read from memory. The ridge point is the hardware's peak FLOPs divided by its memory bandwidth — the intensity above which you're compute-bound and below which you're bandwidth-bound. Decode's intensity is approximately the batch size, because each weight byte read is used for one multiply-add per sequence in the batch. With ridge points in the 150–300 range, decode needs a batch in the low hundreds to stop being bandwidth-bound.
A GPU with 3× the FLOPs and the same memory bandwidth: what improves?
Prefill, and therefore TTFT on long prompts. ITL barely moves at small batch sizes, because decode is limited by bandwidth, which didn't change. The upgrade also raises the ridge point, meaning you now need an even larger batch to become compute-bound in decode.
Why does one long prompt make other users' output stutter, and what fixes it?
Prefill for a very long prompt occupies the GPU for a whole scheduler step or several, during which no decode steps run — so every streaming user pauses mid-sentence. Chunked prefill fixes it by splitting the long prefill into pieces interleaved with decode steps. The cost is a slightly worse TTFT for the long request in exchange for much better ITL for everyone else.
Two servers report the same tokens/sec. What can still differ?
Almost everything that matters: the split between prompt and output tokens (prefill tokens are much cheaper per token, so a prefill-heavy mix inflates the number); the concurrency it was measured at; and the resulting TTFT and ITL. One could be serving 100 users at a comfortable rate and the other one user very fast, with identical aggregate throughput.
Reason about a trade-off
Users report "it takes ages to start but then it's fine." Diagnose.
That's a TTFT problem with healthy ITL, so decode is fine and the issue is before the first token. Two candidates, distinguished by whether it correlates with load: if TTFT tracks concurrency, it's queueing and the answer is more replicas or admission control; if it tracks prompt length, it's prefill cost and the answers are shorter prompts, prefix caching for shared prefixes, or more compute. Check whether long prompts are the culprit before touching any batching flag.
A RAG service: 4,000-token prompts, 150-token answers. What's different about tuning it?
It's prefill-dominated — roughly 27 prompt tokens per output token — so most of its GPU time and most
of its user-visible latency are TTFT. Consequences: prefix caching is high-value if documents repeat;
compute matters more than bandwidth when choosing hardware; --max-num-batched-tokens becomes a
primary knob; and benchmarking with short prompts will tell you nothing useful. Tuning the decode
batch, the standard advice, moves very little here.
You must hold p95 ITL under 40 ms. How does that constrain batch size?
It caps it. ITL rises with batch size, so there's a maximum concurrent decode batch that still meets
40 ms on your hardware and model, and throughput is then whatever that batch yields — not whatever
maximises tokens/sec. Practically: measure ITL against concurrency, find where it crosses 40 ms, set
--max-num-seqs below that, and scale out with replicas for more capacity. Tuning for throughput and
checking latency afterwards gets this backwards.
When is prefill/decode disaggregation worth it, and when is it premature?
Worth considering at large scale with a strongly skewed phase mix, where you can keep both specialised pools well utilised and the KV cache transfer between them is cheap relative to the gains. Premature nearly everywhere else: it adds a network hop carrying KV cache, a second failure domain, and substantial operational complexity, in exchange for efficiency you can usually get more cheaply by right-sizing one pool. Chunked prefill already solves the interference problem that motivates it for most people.
Cheat Sheet
The two phases
| Prefill | Decode | |
|---|---|---|
| Passes | One, over the whole prompt | One per output token |
| Parallelism | Full | None (inherently sequential) |
| Bound by | Compute (FLOPs) | Memory bandwidth |
| Arithmetic intensity | High — thousands | ≈ batch size |
| Metric | TTFT | ITL / TPOT |
| Batching helps? | Barely | Enormously |
| Buy more of | FLOPs | Bandwidth |
The formulas
end-to-end latency = TTFT + (output_tokens − 1) × ITL

ridge point        = peak FLOPs ÷ memory bandwidth        (~150–300 on current datacenter GPUs)
decode intensity   ≈ batch size                            → batch of ~200 to become compute-bound
The asymmetry to memorise
| Longer prompt | More concurrency | |
|---|---|---|
| TTFT | ⬆️ | ⬆️ |
| ITL | ➡️ | ⬆️ |
| Throughput | ➡️ | ⬆️⬆️ |
Diagnosis table
| Symptom | Phase | First thing to check |
|---|---|---|
| Slow to start, then fine | Prefill / queue | Prompt length, then concurrency |
| Starts fast, types slowly | Decode | Batch size, model size, bandwidth |
| Stutters mid-stream | Interference | Chunked prefill enabled? Long prompts in the mix? |
| Great benchmark, unhappy users | Measurement | You reported aggregate throughput, not per-user ITL |
Flags
--max-num-batched-tokens N    # tokens per scheduler step; lower = smoother ITL
--max-num-seqs N              # cap on concurrent sequences = cap on decode batch
--enable-chunked-prefill      # interleave long prefills with decode (default on in current vLLM)
Sources
- vLLM optimisation and tuning (chunked prefill, batching defaults) — docs.vllm.ai/en/stable/configuration/optimization/
- Williams, Waterman & Patterson, Roofline: An Insightful Visual Performance Model — the origin of the arithmetic-intensity / ridge-point framing
← Previous: The KV Cache · Next: PagedAttention →
⚠️ Verification checklist (delete before publishing)
Hardware figures — all from memory, all need confirming
- T4: ~65 TFLOP/s fp16 tensor, 320 GB/s → ridge ~203.
- A100: ~312 TFLOP/s bf16, 2039 GB/s → ridge ~153. Confirm which A100 SKU (40 GB vs 80 GB differ in bandwidth) and state it.
- H100: ~990 TFLOP/s bf16, ~3350 GB/s → ridge ~295. Confirm SKU (SXM vs PCIe differ).
- Confirm whether these peak FLOPs figures include sparsity (vendor sheets often quote the sparse number, which would roughly halve the honest ridge point). This materially changes the "batch of ~200" claim.
vLLM defaults — these have changed repeatedly
-
--max-num-seqs: the page no longer quotes a number. It's platform- and version-dependent and isn't stated in the tuning docs, so the page tells readers to read their own value. Same treatment applied on Continuous Batching and the Stage 2 scheduler page. -
--max-num-batched-tokensdefault. Reported as dynamic (8,192–32,768) in V1 and fixed (512 or 2,048) in older versions. The page deliberately avoids a number — confirm that's still the right call. - Chunked prefill "always enabled by default in V1" — confirm, including whether it can still be disabled and via which flag. The Try It third experiment depends on being able to turn it off.
- Confirm the flag spelling
--enable-chunked-prefilland whether a--no-enable-chunked-prefillform exists.
The central technical claim
- "Decode arithmetic intensity ≈ batch size." Verify the derivation (2 FLOPs per weight per sequence ÷ 2 bytes per weight in fp16). Confirm the framing holds once attention over the KV cache is included — attention reads scale with sequence length and are excluded here, which is fine for a first-order model but should be stated as an approximation.
- Confirm that ITL really is flat against prompt length in practice; attention cost grows with context, so at very long contexts the claim weakens. Consider adding a caveat with a measured threshold.
Code
- Run
ttft_itl.pyagainst a real server and replace the UNVERIFIED table. -
"word " * prompt_tokensproduces approximately, not exactly, that many tokens. Either tokenise properly or relabel the column as approximate. - Confirm
client.completions.createstreaming chunk shape —chunk.choices[0].textfor the completions endpoint versus.delta.contentfor chat completions. -
concurrency.pyimports fromttft_itl, which will re-run that module's top-level loop on import. Guard it withif __name__ == "__main__":before publishing. - Verify the throughput formula in
concurrency.pyis a fair aggregate measure, or replace it with a direct wall-clock total. - Run the chunked-prefill on/off comparison and confirm the described stall actually appears.
Rendering
- Two images generated and placed; rows added to
image-prompts.md. - The ASCII request-timeline block renders correctly on the published site.
- All relative links resolve once target files exist.