
04 · Continuous Batching
This is the page where the reclaimed memory gets spent.
PagedAttention stopped you wasting 60–80% of your KV cache, which means you can now hold several times more sequences. Holding them is worthless unless something keeps them all working, and that something is the scheduler running at token granularity rather than request granularity.
The idea has two names in the literature — iteration-level scheduling (from the Orca paper, which introduced it) and continuous batching (what everyone calls it now). They're the same thing, and it's the other half of why vLLM is fast.
The Problem
You took the advice from Stage 0 and batched your requests. Throughput went up several-fold. Then:
- Your p50 latency is fine and your p99 is appalling. Not slightly worse — an order of magnitude, and it doesn't correlate with request size in any way you can explain.
- A 12-token answer takes as long as an 800-token answer. Users asking trivial questions wait as long as users asking for essays, which makes no sense to them and none to you.
- GPU utilisation sawtooths. High at the start of each batch, trailing to almost nothing, then spiking again. You can watch it happen.
- New requests wait even though the GPU is nearly idle. There is capacity, visibly, and it isn't being used.
One cause. Static batching — also called request-level batching — collects a group of requests, runs them together, and returns them together. It's what every non-LLM serving system does, correctly, because image classification requests all take the same time.
Text generation doesn't. Take a realistic batch of 8 and their output lengths:
request:   A    B    C    D    E    F    G     H
tokens:   12   15   20   31   44   60  800   950
The batch runs for 950 steps — the longest member. Slot-steps available: 8 × 950 = 7,600. Slot-steps doing real work: 12+15+…+950 = 1,932.
74.6% of the batch's compute was spent on sequences that had already finished.
Request A got its answer after 12 steps and waited another 938 for the transport to leave. And for that entire time, no new request could be admitted — the batch is a fixed group, so arrivals queue until the whole thing clears.
That's two distinct failures stacked:
| Failure | What it costs |
|---|---|
| Head-of-line blocking — finished sequences hold their slots | Wasted compute; terrible latency for short requests |
| Fixed batch membership — no admission mid-flight | Arrivals queue behind a batch that's mostly idle |
The metric that exposes both is normalised latency: end-to-end latency divided by output tokens generated. Under static batching, request A's normalised latency is ~79× worse than request H's, for no reason other than who it was batched with.
The Idea
A restaurant that ran on static batching would seat a table of eight, take all their orders, cook everything, and refuse to bring anyone their food until the last dish was ready. Then it would clear the entire table before seating anyone new — even the four seats that emptied twenty minutes ago.
Nobody runs a restaurant that way. The pass never goes empty. A dish is ready, it goes out. The seat frees, the next party sits down. The chef isn't cooking "a table" — they're working a continuous stream where each dish enters and leaves independently, and the only question at any moment is what should be on the heat right now?
The reframe that makes everything else follow:
A batch is not a group of requests. It's a set of slots, and its membership is re-decided every single token step.
Once you hold that, the failures dissolve rather than get mitigated:
- A sequence that finishes leaves immediately — at the end of that step, not at the end of "the batch". Its slot and its memory are free within milliseconds.
- A waiting request joins as soon as a slot and the memory exist, not when some group completes.
- There is no "longest member" any more, because there is no fixed membership for anyone to be longest in.
Note what this doesn't claim. The chef isn't cooking faster. Each dish takes exactly as long as it did. What changed is that the kitchen is never idle and no dish sits under the heat lamp waiting for the table's slowest order.
Under the Hood
The step loop
Every iteration of the engine does this:
   ┌──────────────────────────────────────────────────────────────┐
   │                                                              │
   ▼                                                              │
1. SCHEDULE   choose which sequences run this step, subject to:   │
              · token budget  (--max-num-batched-tokens)          │
              · sequence cap  (--max-num-seqs)                    │
              · free KV blocks available                          │
   │                                                              │
2. EXECUTE    ONE forward pass over the chosen set                │
              → one new token for each running sequence           │
   │                                                              │
3. RETIRE     sequences that hit EOS / max_tokens / a stop string │
              leave now; their KV blocks return to the pool       │
   │                                                              │
4. ADMIT      waiting requests are admitted if blocks now free    │
              (their prefill may be chunked across future steps)  │
   │                                                              │
5. PREEMPT    if memory is short, evict a running sequence        │
              (its cache is recomputed when it resumes)           │
   │                                                              │
   └──────────────────────────────────────────────────────────────┘
                        repeat, every single token
The loop runs at whatever a decode step costs — on the order of ten milliseconds. So batch membership is being reconsidered a hundred times a second.
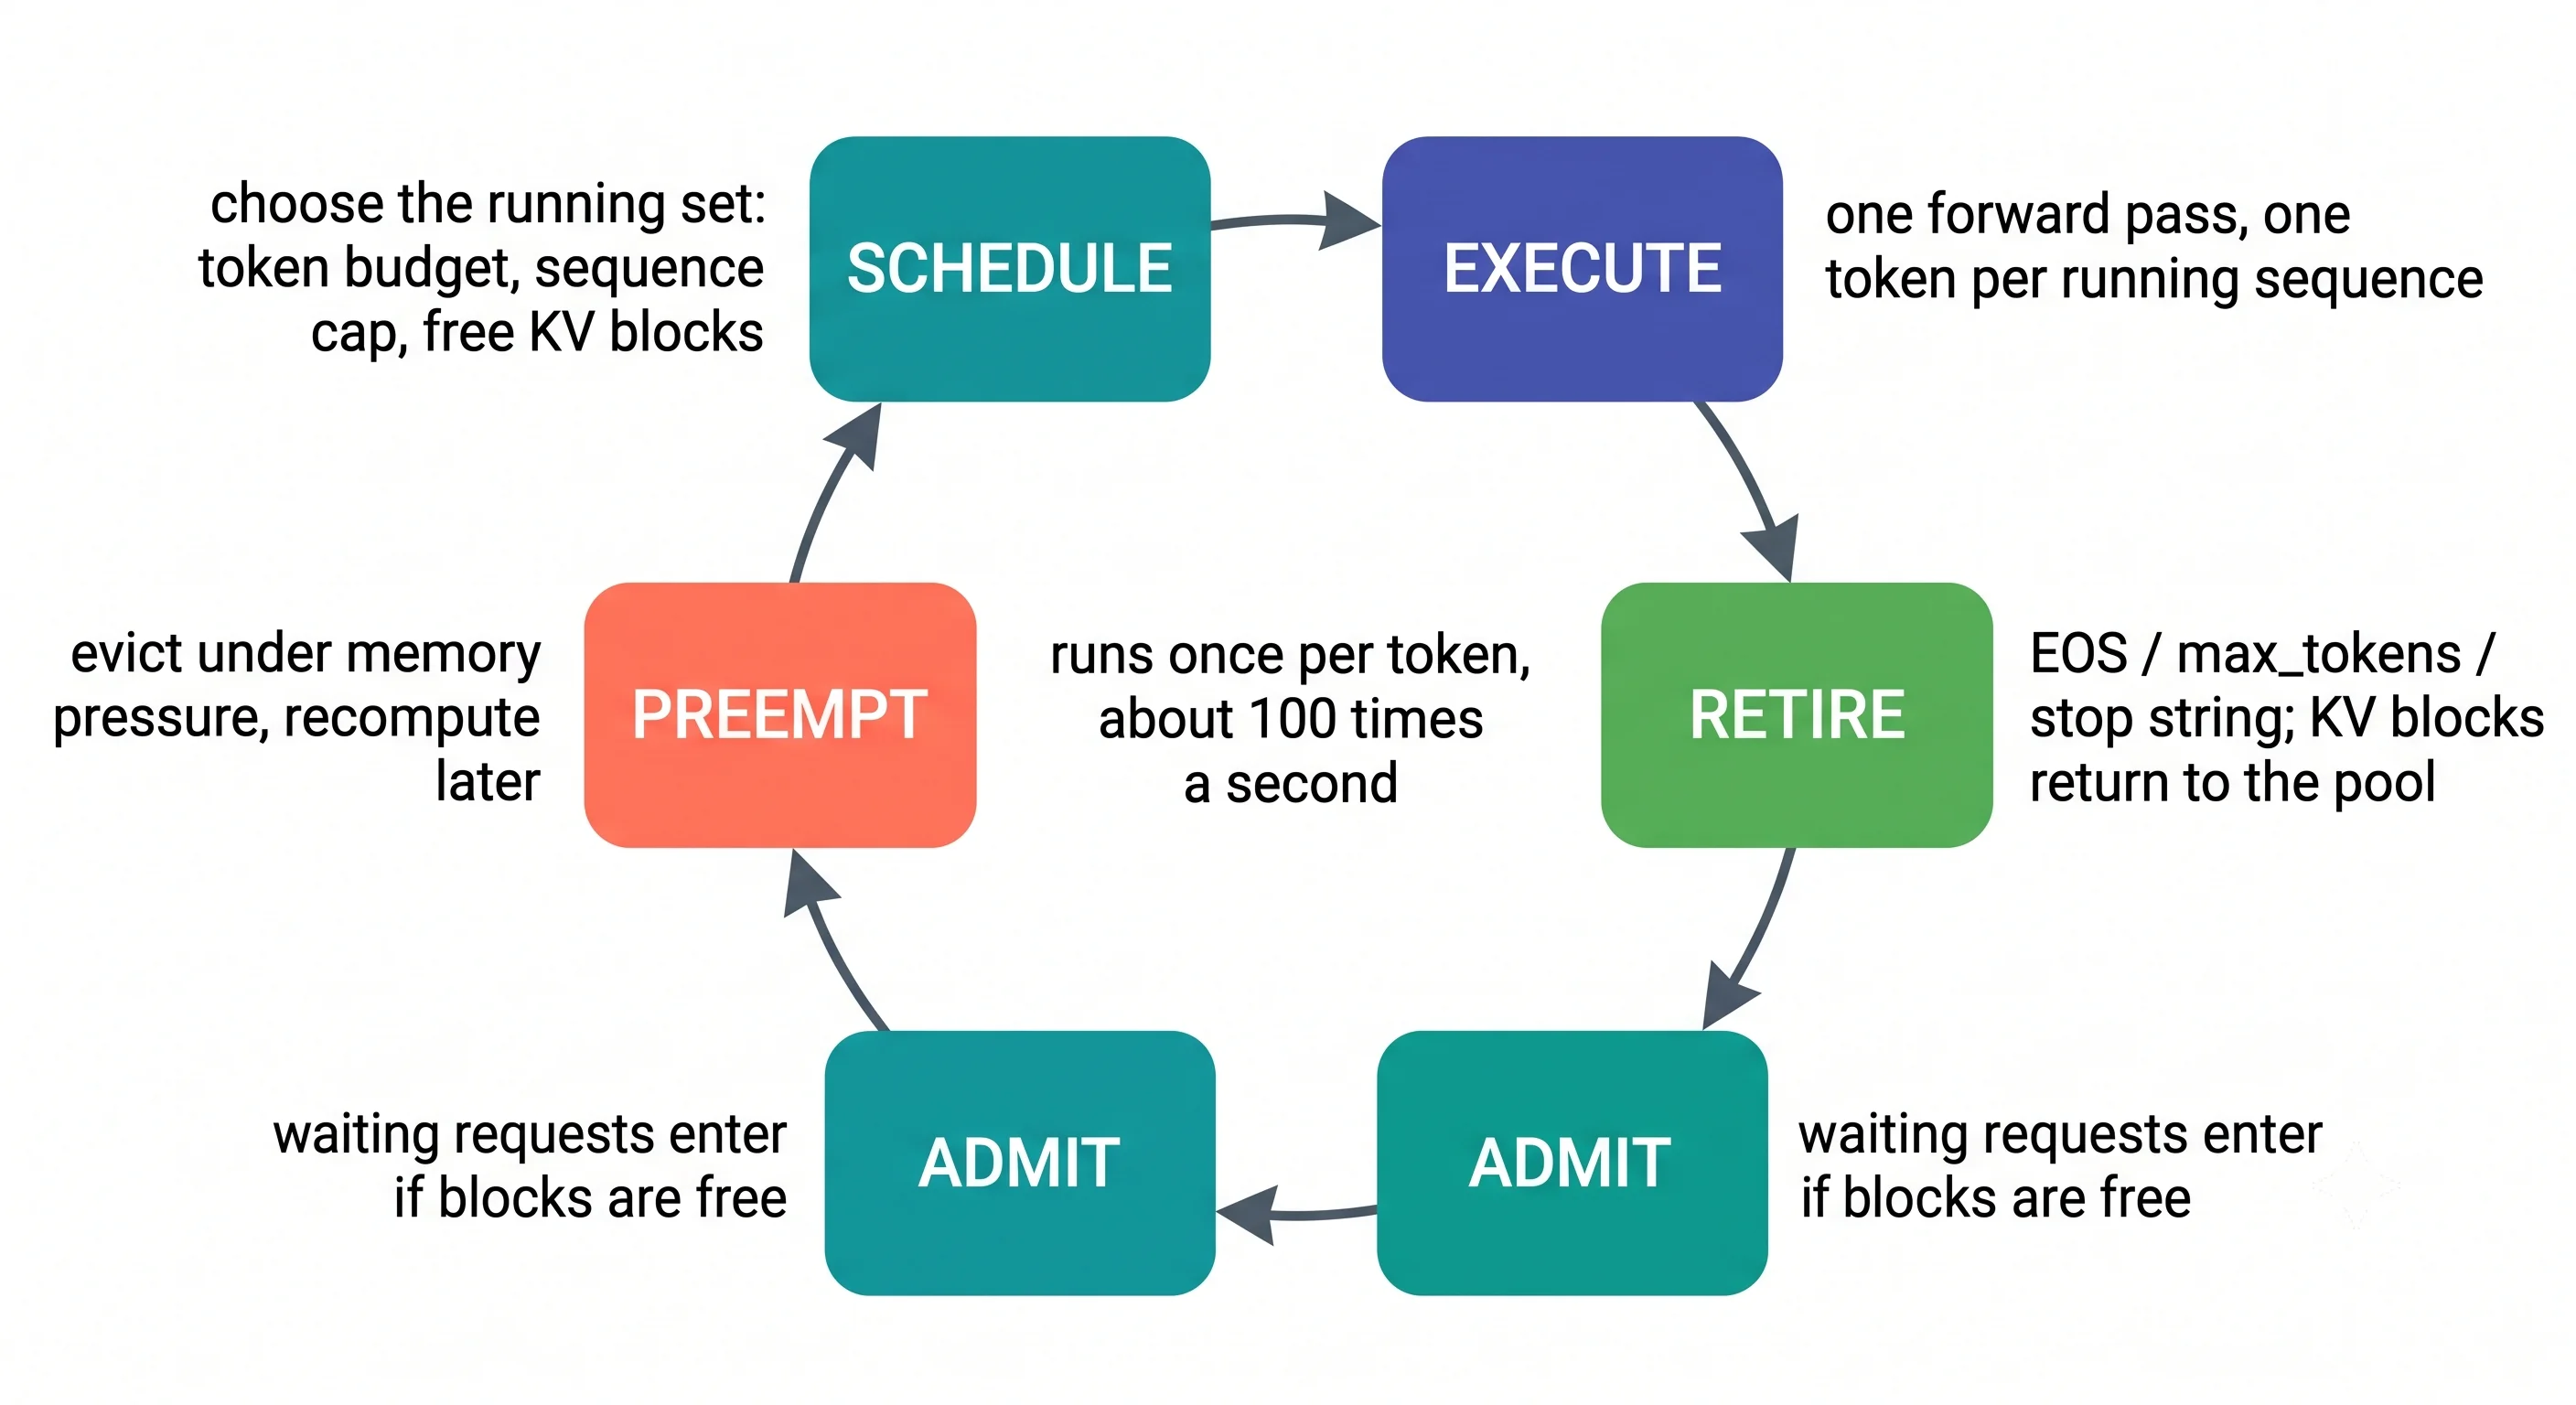
What had to be true for this to work
Iteration-level scheduling sounds obvious once stated. It wasn't feasible before, for two reasons that are worth understanding because they explain why these ideas arrived together.
1. Sequences must be able to join and leave without moving memory. In a contiguous-cache system, a batch is a tensor and a sequence's position in it is a physical offset. Removing a finished sequence means compacting the tensor — copying gigabytes — or leaving a hole. With block tables, membership is just which block tables you hand to the kernel this step. Nothing moves.
This is the dependency that makes PagedAttention and continuous batching complementary rather than independent optimisations. Paging reclaims the memory; continuous batching spends it; and paging is also the mechanism that makes cheap membership changes possible at all.
2. The forward pass must tolerate ragged lengths. In one step, sequence A is at token 12 and sequence H is at token 803. They share a forward pass over the weights while attending over caches of completely different lengths. That's what the paged attention kernel does, and it's why "just batch them" wasn't a five-line change to an existing serving stack.
Prefill and decode in the same step
A subtlety that trips people: newly admitted requests need prefill, while everything already
running needs decode. Modern vLLM mixes both in a single step, with the token budget
(--max-num-batched-tokens) spent across them, and long prefills split into chunks — the chunked
prefill from Prefill vs Decode.
So a single step might be: 4,000 prefill tokens for two arriving requests, plus one decode token each for 180 running ones. The scheduler's job is dividing that budget, and it's why the two flags interact.
What it does to your numbers
| Static batching | Continuous batching | |
|---|---|---|
| Slot-step utilisation (the example above) | 25.4% | ~100% in steady state |
| Short request's latency | The longest member's | Its own |
| Admission of a new request | After the batch clears | Within a step or two |
| Normalised latency, spread across requests | Enormous | Nearly flat |
| Per-user ITL at a given load | Better (smaller effective batch) | Slightly worse (fuller batch) |
That last row is the honest one and it's usually omitted. Continuous batching keeps the batch fuller than static batching does on average, and a fuller batch means each user's tokens arrive slightly slower — the trade-off from Prefill vs Decode, where decode intensity rises with batch size. You are trading a little per-user speed for a large amount of throughput and an enormous improvement in tail latency.
Try It
Experiment 1 — normalised latency, the metric that exposes the problem (no GPU)
Before measuring a real server, simulate both schedulers. Thirty lines, and it makes the 74.6% number something you generated rather than read.
# batching_sim.py — static vs continuous scheduling on the same workload.
import random
random.seed(0)

N_REQUESTS = 500
MAX_SLOTS  = 32                     # concurrent sequences the GPU can hold
lengths    = [max(1, int(random.lognormvariate(4.2, 1.1))) for _ in range(N_REQUESTS)]

# --- STATIC: fixed groups of MAX_SLOTS; the group runs for max(lengths in group) ---
static_steps, static_latency = 0, {}
for i in range(0, N_REQUESTS, MAX_SLOTS):
    group = lengths[i:i + MAX_SLOTS]
    dur = max(group)
    for j, L in enumerate(group):
        static_latency[i + j] = static_steps + dur        # everyone waits for the slowest
    static_steps += dur
static_slot_steps = static_steps * MAX_SLOTS

# --- CONTINUOUS: a slot frees the instant its sequence ends; next request enters ---
slots = [0] * MAX_SLOTS             # step at which each slot becomes free
cont_latency = {}
for idx, L in enumerate(lengths):
    s = slots.index(min(slots))     # earliest-free slot
    start = slots[s]
    cont_latency[idx] = start + L
    slots[s] = start + L
cont_steps = max(slots)
cont_slot_steps = cont_steps * MAX_SLOTS

useful = sum(lengths)
print(f"useful slot-steps        : {useful:,}")
print(f"static:  {static_steps:>6} steps  utilisation {useful/static_slot_steps:>6.1%}")
print(f"continuous: {cont_steps:>4} steps  utilisation {useful/cont_slot_steps:>6.1%}")

# normalised latency = latency per output token. Flat is fair; spread is unfair.
for name, lat in [("static", static_latency), ("continuous", cont_latency)]:
    norm = sorted(lat[i] / lengths[i] for i in range(N_REQUESTS))
    print(f"{name:<11} normalised latency  p50 {norm[len(norm)//2]:>8.1f}   "
          f"p99 {norm[int(len(norm)*0.99)]:>9.1f}")
useful slot-steps : 59,092
static: 8,942 steps utilisation 20.7%
continuous: 2,206 steps utilisation 83.7%
static normalised latency p50 56.1 p99 1015.0
continuous normalised latency p50 9.7 p99 173.6What you should observe: continuous batching finishes the same work in roughly a quarter of the steps, and its p99 normalised latency is about 5.8× better. The throughput gain is nice; the tail-latency gain is the one users feel.
Note that continuous batching lands at 83.7%, not ~100%. The gap is drain at the end of the run — as the last requests finish, slots empty and can't be refilled because no work remains. A real server under sustained load doesn't have that boundary, so treat 83.7% as an artefact of a finite simulation rather than a ceiling.
Now change one thing
Change the length distribution's spread — the second parameter of lognormvariate — from 1.1 to
0.1, making every request nearly the same length. Re-run.
What you should observe: the two schedulers converge. Measured across the full sweep:
sigma |
Static utilisation | Continuous utilisation | p99 ratio (static ÷ continuous) |
|---|---|---|---|
| 1.1 (high variance) | 20.7% | 83.7% | 5.8× |
| 0.6 | 37.4% | 94.6% | 2.8× |
| 0.3 | 58.2% | 95.8% | 1.7× |
| 0.1 (near-uniform) | 81.5% | 97.1% | 1.2× |
Static batching goes from wasting four fifths of its slot-steps to wasting less than a fifth, purely because the lengths stopped varying. The tail-latency advantage falls from 5.8× to 1.2× — close to nothing.
That's the most important result on this page, and it's the one nobody puts in a benchmark: continuous batching's advantage comes entirely from variance in output length. Uniform lengths, no advantage. Which tells you exactly where it will and won't help before you deploy anything.
Experiment 2 — see it on a real server
Hardware: Colab T4 or any CUDA GPU.
vllm serve Qwen/Qwen2.5-0.5B-Instruct --max-model-len 2048# mixed_lengths.py — eight requests, wildly different lengths, all at once.
import concurrent.futures as cf, time
from openai import OpenAI
client = OpenAI(base_url="http://localhost:8000/v1", api_key="EMPTY")
MODEL = "Qwen/Qwen2.5-0.5B-Instruct"
BUDGETS = [16, 16, 32, 32, 64, 128, 512, 512] # wildly uneven, on purpose
def run(max_tokens):
t0 = time.perf_counter()
r = client.completions.create(
model=MODEL, prompt="Count upwards, one number per line, starting from one.",
max_tokens=max_tokens, temperature=0.0,
)
dt = time.perf_counter() - t0
n = len(r.choices[0].text.split())
return max_tokens, dt, dt / max(n, 1)
t_start = time.perf_counter()
with cf.ThreadPoolExecutor(max_workers=len(BUDGETS)) as ex:
results = list(ex.map(run, BUDGETS))
total = time.perf_counter() - t_start
print(f"{'max_tokens':>10} {'latency (s)':>12} {'normalised (s/tok)':>20}")
for mt, dt, norm in sorted(results):
print(f"{mt:>10} {dt:>12.2f} {norm:>20.4f}")
print(f"\nwall clock for all eight: {total:.2f}s")What you should observe, and why each observation matters:
| Observation | What it proves |
|---|---|
| The 16-token requests return in a fraction of a second, not after the 512-token ones | Sequences retire independently. No head-of-line blocking |
| Latency scales with each request's own length | The batch has no "longest member" holding others hostage |
| Normalised latency is roughly flat across all eight | Fairness — the property static batching destroys |
| Total wall clock ≈ the longest request alone, not the sum | All eight genuinely ran concurrently |
Then change one thing: set every budget to 512. Total wall clock barely moves, but you've lost the demonstration — with uniform lengths there's nothing for continuous batching to exploit, exactly as the simulation predicted.
Dial It In
| Knob | What it trades | Sane start | Move it when |
|---|---|---|---|
--max-num-seqs |
Ceiling on sequences in the running set. Higher = more throughput, worse per-user ITL | Your build's default — check vllm serve --help |
Lower it to defend an ITL target. Raising it only helps if KV blocks are actually free |
--max-num-batched-tokens |
Token budget per step, split between prefill and decode. Higher = better prefill throughput; lower = smoother ITL | Default | ITL spikes when long prompts arrive → lower. Batch/offline work → raise |
--enable-chunked-prefill |
Lets long prefills share steps with decode instead of monopolising them | On (default in current versions) | Turning it off is almost always wrong for interactive serving |
--scheduling-policy |
Ordering of the waiting queue — FCFS versus priority | fcfs |
You have genuine tiers of traffic and need one to jump the queue |
The one that matters is --max-num-seqs, and the reason is counter-intuitive: its useful role is
as a brake, not an accelerator. Continuous batching will happily fill the batch to the memory
limit, maximising throughput and degrading every user's ITL. If you have a per-user speed target,
this flag is how you enforce it.
⚠️ Defaults have moved repeatedly across vLLM versions — verify against yours.
Where It Bites You
Expecting a benefit at concurrency 1. With one request there is nothing to batch, nothing to interleave, and no head-of-line blocking to prevent. Continuous batching's value is exactly zero here, and vLLM's fixed overheads are not. This is the single most common source of "we benchmarked vLLM and it wasn't faster", and it's a correct measurement of the wrong thing.
Expecting a benefit with uniform output lengths. You proved this in the simulation: the advantage comes from variance. An offline batch job where every request generates exactly 256 tokens gets nearly nothing from iteration-level scheduling, because static batching was already near-optimal for that shape. Know which of the two workloads you have.
Benchmarking with a fixed max_tokens and no stop handling. You've manufactured uniform
lengths, which is the case where continuous batching doesn't help — so your benchmark understates it
in production and overstates static batching. Vary output lengths, or let the model actually stop.
Assuming it improves per-user latency. It improves queueing latency dramatically and tail
latency enormously. It makes steady-state ITL slightly worse, because it keeps the batch fuller
than static batching does on average. If a user's complaint is "it types slowly", continuous batching
is not the fix and may be a contributor — cap --max-num-seqs.
Client-side batching on top of it. Well-meaning clients that collect requests for 50 ms before sending them are re-implementing static batching in front of a continuous batcher. It adds pure latency and removes the scheduler's ability to admit requests as slots open. Send requests as they arrive; that's the whole design.
FCFS is not fairness. The default queue is first-come-first-served, and a burst of long requests admitted first will hold their slots for thousands of steps while short requests queue behind them. Continuous batching fixed head-of-line blocking within a batch; it doesn't prevent starvation at the admission queue. That's a scheduling-policy question, and it's why priority scheduling exists.
Reading preemption as a batching failure. When blocks run out, the scheduler evicts running sequences and redoes their work later. That's the memory limit asserting itself, not the batcher misbehaving — see The Scheduler & Block Manager.
In Production
Watch running versus waiting, as a pair. vLLM reports the number of sequences currently running and the number queued. The ratio is your diagnosis:
| Running | Waiting | Diagnosis |
|---|---|---|
At max_num_seqs |
> 0 | Concurrency-capped. Raise the cap if KV cache allows, else add a replica |
| Below the cap | > 0 | Memory-capped — blocks are exhausted. Check KV utilisation and preemption |
| Below the cap | 0 | Under-loaded. You have headroom |
That table distinguishes "add a replica" from "change a flag" from "do nothing", and it's most of what an on-call engineer needs. Observability.
Tail latency is the metric that improved, so measure the tail. Continuous batching's headline gain is p99, not p50. A dashboard showing only averages will under-report the benefit and, worse, won't notice when a misconfiguration takes it away. Track normalised latency percentiles if you can — a widening spread means short requests are being penalised again.
What changes at 10× traffic. The scheduler keeps working correctly right up until KV blocks run out; then it starts preempting, and preempted sequences must be recomputed, so effective throughput falls while load rises. The degradation is therefore non-linear and the leading indicator is KV cache utilisation, not latency. Alert there.
The workload-shape question, answered before you deploy. From the
Stage 0 workload script: if your p99 output length
is close to your p50, continuous batching buys you little and your capacity planning can be simple.
If p99 is many times p50 — which is typical for chat and agents — it's doing most of the work of
keeping your tail latency survivable, and anything that flattens output-length variance (a fixed
max_tokens for everyone, say) will quietly cost you.
Check Yourself
Recall the idea
What's the difference between static and continuous batching, in one sentence?
Static batching schedules at request granularity — a fixed group runs together and returns together — while continuous batching schedules at token granularity, re-deciding the batch's membership every step so finished sequences leave immediately and waiting ones join.
What is head-of-line blocking in a static batch, and what does it cost?
Every request holds its slot until the longest member of its batch finishes. It costs compute (slot-steps spent on already-finished sequences — 74.6% in the page's example) and it destroys short requests' latency, which becomes a function of who they were batched with rather than what they asked for.
What is normalised latency and why is it the right metric here?
End-to-end latency divided by output tokens generated. It exposes unfairness that raw latency hides: under static batching a 12-token request and an 800-token request have similar raw latency, which means wildly different normalised latency. A flat normalised-latency distribution means the scheduler is treating requests proportionally to what they asked for.
Does continuous batching make individual requests faster?
No. It removes waiting — for a slot, and for other requests to finish — so queueing and tail latency improve enormously. Steady-state per-token speed is slightly worse, because the batch is kept fuller on average.
Explain the mechanics
Walk through one scheduler step.
Schedule: choose the running set subject to the token budget, the sequence cap and free KV blocks.
Execute: one forward pass producing one token for each running sequence. Retire: sequences hitting
EOS, max_tokens or a stop string leave, returning their blocks to the pool. Admit: waiting requests
enter if blocks are now free, with prefill possibly chunked over several steps. Preempt: if memory is
short, evict a running sequence, whose cache is recomputed when it resumes. Then repeat — roughly a hundred
times a second.
Why does continuous batching depend on PagedAttention?
Because membership changes must be cheap. With a contiguous cache, a sequence's place in the batch is a physical offset, so removing a finished one means compacting a huge tensor or leaving an unusable hole. With block tables, a sequence's memory is wherever its blocks are, and joining or leaving the batch is just a change in which block tables get passed to the kernel. Paging both reclaims the memory and makes the membership churn free.
How can one forward pass serve sequences at completely different positions?
The paged attention kernel takes each sequence's block table and handles ragged cache lengths. All sequences share the same weight matrices for the step — which is where the efficiency comes from — while each attends over its own cache of its own length. Weights are shared; attention is per sequence.
Where does continuous batching's advantage come from, mathematically?
Variance in output length. Static batching's waste is slots × max(lengths) − sum(lengths), which is
zero when all lengths are equal and grows with the spread. Continuous batching drives it to
approximately zero regardless. So the benefit is a function of the length distribution, not of the
scheduler being cleverer in general.
Reason about a trade-off
A colleague benchmarked vLLM against a simple batched script and found no improvement. What do you ask?
Two questions. What concurrency — if it's one, or a handful, there's nothing to schedule and the
result is expected rather than surprising. And what was the output-length distribution — if every
request had the same fixed max_tokens with no early stopping, they built the one workload where
static batching is already near-optimal. Both are extremely common benchmark shapes and both are
unrepresentative of interactive serving. If concurrency was high and lengths varied and there was
still no gain, that's genuinely interesting and worth investigating properly.
You must hold p95 ITL under 40 ms. How does continuous batching complicate that?
It works against you, by design: left alone it fills the batch to the memory limit, maximising
throughput while every user's tokens arrive more slowly. So the target has to be enforced from
outside, by capping --max-num-seqs below the concurrency at which ITL crosses 40 ms. Measure ITL
against concurrency, find the crossing, cap below it, and add replicas for capacity beyond that. The
mistake is tuning for throughput and treating ITL as something to check afterwards.
One tenant sends 50 requests of 4,000 tokens each. What happens to everyone else, and what fixes it?
They're admitted FCFS, occupy most of the slots and most of the KV cache, and hold them for thousands
of steps. Other users queue — not because of head-of-line blocking inside a batch, which continuous
batching solved, but because of starvation at the admission queue, which it doesn't address. Fixes
live at three levels: priority scheduling so other traffic can jump the queue; per-tenant rate and
concurrency limits at the gateway; or separate replica pools for long-running work. Raising
max_num_seqs doesn't help, because the binding constraint is KV cache.
When would static batching be the better choice?
An offline batch job with uniform output lengths, no latency requirement, and full control of the GPU — where continuous batching's advantage is near zero and the simpler system has less to go wrong. It's a narrow case, and worth knowing mainly because it's exactly the shape of most benchmarks, which is why benchmarks so often fail to show the difference.
Cheat Sheet
The reframe
A batch is not a group of requests. It's a set of slots whose membership is re-decided every token step.
The step loop
schedule → execute (one forward pass, one token each) → retire → admit → preempt → repeat
   ↑ constrained by: --max-num-batched-tokens, --max-num-seqs, free KV blocks
Static vs continuous
| Static | Continuous | |
|---|---|---|
| Scheduling granularity | Request | Token |
| Finished sequence | Holds its slot | Leaves immediately |
| New arrival | Waits for the batch | Joins within a step or two |
| Slot-step utilisation | Poor with varied lengths | ~100% |
| p99 normalised latency | Terrible | Nearly flat |
| Per-user ITL | Slightly better | Slightly worse |
| Advantage comes from | — | Variance in output length |
Diagnosis: running vs waiting
| Running | Waiting | Meaning |
|---|---|---|
At max_num_seqs |
> 0 | Concurrency-capped → raise cap if memory allows |
| Below cap | > 0 | Memory-capped → check KV utilisation, preemption |
| Below cap | 0 | Headroom available |
Flags
--max-num-seqs N              # the brake, not the accelerator. Cap it to defend an ITL target
--max-num-batched-tokens N    # per-step token budget, split between prefill and decode
--enable-chunked-prefill      # let long prefills share steps with decode (default on)
--scheduling-policy fcfs      # FCFS is the default, and FCFS is not fairness
The two things to remember
- Continuous batching's benefit is proportional to variance in output length. No variance, no benefit.
- It fixes head-of-line blocking inside a batch. It does nothing about starvation at the admission queue — that needs priority scheduling or gateway limits.
Sources
- Yu et al., Orca: A Distributed Serving System for Transformer-Based Generative Models, OSDI 2022 — the origin of iteration-level scheduling — usenix.org/conference/osdi22/presentation/yu
- Kwon et al., Efficient Memory Management for Large Language Model Serving with PagedAttention, SOSP 2023 — arxiv.org/abs/2309.06180
- vLLM optimisation and tuning docs — docs.vllm.ai/en/stable/configuration/optimization/
← Previous: PagedAttention · Next: Sampling Parameters →
⚠️ Verification checklist (delete before publishing)
The worked example
- The 8-request example: lengths 12/15/20/31/44/60/800/950 sum to 1,932; 8 × 950 = 7,600; waste = 5,668 / 7,600 = 74.6%; utilisation 25.4%. Arithmetic checked.
- The "~79× worse normalised latency" for request A — recompute and state the assumption explicitly (950/12 = 79.2, i.e. comparing raw latency per token against request H).
Defaults
-
--max-num-seqs: number removed. Platform- and version-dependent; the page now points readers at their own build. Consistent with Prefill vs Decode and the Stage 2 scheduler page. - Confirm
--scheduling-policyexists with that name and thatfcfsis the default; confirm what the priority alternative is called. - Removed from the page. V1 has no recompute-vs-swap choice — GPU↔CPU KV swapping was removed entirely, so preemption always recomputes.
- Confirmed: "In V1, chunked prefill is enabled by default whenever possible." Stated consistently across all three pages.
Technical claims
- The claim that continuous batching makes steady-state ITL slightly worse than static batching at equal load. This follows from the fuller-batch argument but is asserted without a source or measurement — either measure it or soften the wording.
- Confirm that prefill and decode really are mixed within a single step in the current engine, and that the token budget is shared between them as described.
- Confirm the step loop's ordering (schedule → execute → retire → admit → preempt) matches the actual engine. The pedagogical ordering may not match the implementation's — if it doesn't, say so rather than misdescribe it.
Code
-
batching_sim.pyhas been run. Output replaced with real values. Two corrections fell out: continuous utilisation is 83.7%, not ~100% (end-of-run drain, now explained inline), and the p99 advantage is 5.8×, not "two orders of magnitude" — the original claim was substantially overstated. - The continuous model uses an earliest-free-slot heuristic and ignores KV memory limits and prefill cost entirely. State those simplifications inline so it isn't mistaken for a model of the real scheduler.
- The lognormal (4.2, 1.1) gives a mean of ~118 tokens. Defensible for chat, but ideally substitute a distribution measured from real logs.
- Low-variance convergence confirmed across a sigma sweep (1.1 / 0.6 / 0.3 / 0.1). Static utilisation climbs 20.7% → 81.5% and the p99 advantage falls 5.8× → 1.2×. The page's most important claim holds, and the sweep is now a table rather than an assertion.
- Run
mixed_lengths.pyagainst a real server and capture actual output; confirm all four claimed observations occur. -
run()counts output tokens with.split(), which counts words not tokens. Either use the response's usage field or relabel the column honestly.
Rendering
- One image generated and placed; row added to
image-prompts.md. - The ASCII step-loop block renders correctly on the published site — it uses box-drawing characters and may need a plain fenced block.
- All relative links resolve once target files exist.