
02 · Lifecycle of a Request
You now know how the scheduler decides. This page follows one request all the way through — from the HTTP POST to the last streamed token — and names the component responsible at every step.
The reason to do this explicitly: most of a request's life is spent not being computed. If you only know about prefill and decode, you can account for perhaps a third of the wall clock a user experiences, and you'll look for performance problems in the GPU when they're in a queue, a tokeniser, or a proxy.
The Problem
- Your server logs say the request took 180 ms. The user says it took two seconds. Neither is lying. You're measuring different spans, and nothing in your dashboard reconciles them.
- You have TTFT, and it's bad, and you don't know why. TTFT is a sum of at least three things and you're looking at the total.
- A user hits stop, closes the tab — and your GPU keeps generating the remaining 800 tokens of an answer nobody will read.
- Your prompt isn't the prompt the model saw. Something inserted a system message and some special tokens, and your carefully counted 500-token input became 530.
- GPU utilisation is low, latency is bad, and the scheduler looks healthy. Because the bottleneck is CPU-side: tokenisation and detokenisation are on the critical path and you never counted them.
Each of these is a stage of the lifecycle that isn't prefill and isn't decode. You can't fix what you can't locate.
The Idea
Think about a hospital appointment. The procedure takes eleven minutes. The visit takes four hours.
Nobody who has been a patient is surprised by this, and nobody who has only read the surgeon's notes would predict it. The notes record eleven minutes of work; the day contains registration, a waiting room, triage, prep, the procedure itself, recovery, and discharge paperwork. Improving the surgeon's speed by 20% changes the day by about two minutes.
A request is the same shape. The GPU work is the procedure. Around it sits parsing, templating, tokenising, queueing, streaming and detokenising — and under load, the waiting room dominates everything else.
This gives you the diagnostic instinct for the whole page:
When latency is bad, the question isn't "is the GPU slow?" It's "which stage did the time go into?" — and the answer is usually a stage that isn't computation.
Under the Hood
The full path, with process boundaries
The boundaries matter, because they explain both what can bottleneck and where you'll find the logs.
  CLIENT
    │  POST /v1/chat/completions
    ▼
┌─────────────────────────────────────────────────────────────────┐
│ API SERVER PROCESS  (P0)                                        │
│                                                                 │
│  1. Parse and validate the request body                         │
│  2. Apply the CHAT TEMPLATE      ← silently rewrites your input │
│  3. TOKENISE                     ← CPU work, on the critical path│
│  4. Build SamplingParams, assign a request ID                   │
└─────────────────────────────────────────────────────────────────┘
    │  inter-process handoff
    ▼
┌─────────────────────────────────────────────────────────────────┐
│ ENGINE CORE PROCESS  (P1)  — the scheduler lives here           │
│                                                                 │
│  5. Enter the WAITING queue          ← queueing time starts     │
│  6. Admitted when budget + blocks allow                         │
│  7. PREFILL — one pass over the prompt, chunked if long         │
│  8. DECODE — one step per output token, N times                 │
│     each step emits one token ID                                │
└─────────────────────────────────────────────────────────────────┘
    │  token IDs streamed back
    ▼
┌─────────────────────────────────────────────────────────────────┐
│ API SERVER PROCESS  (P0)                                        │
│                                                                 │
│  9. DETOKENISE incrementally    ← must handle partial UTF-8     │
│ 10. Format as an SSE chunk                                      │
│ 11. Write to the socket                                         │
└─────────────────────────────────────────────────────────────────┘
    │
    ▼
  CLIENT  ← first token appears here. THIS is what TTFT should mean.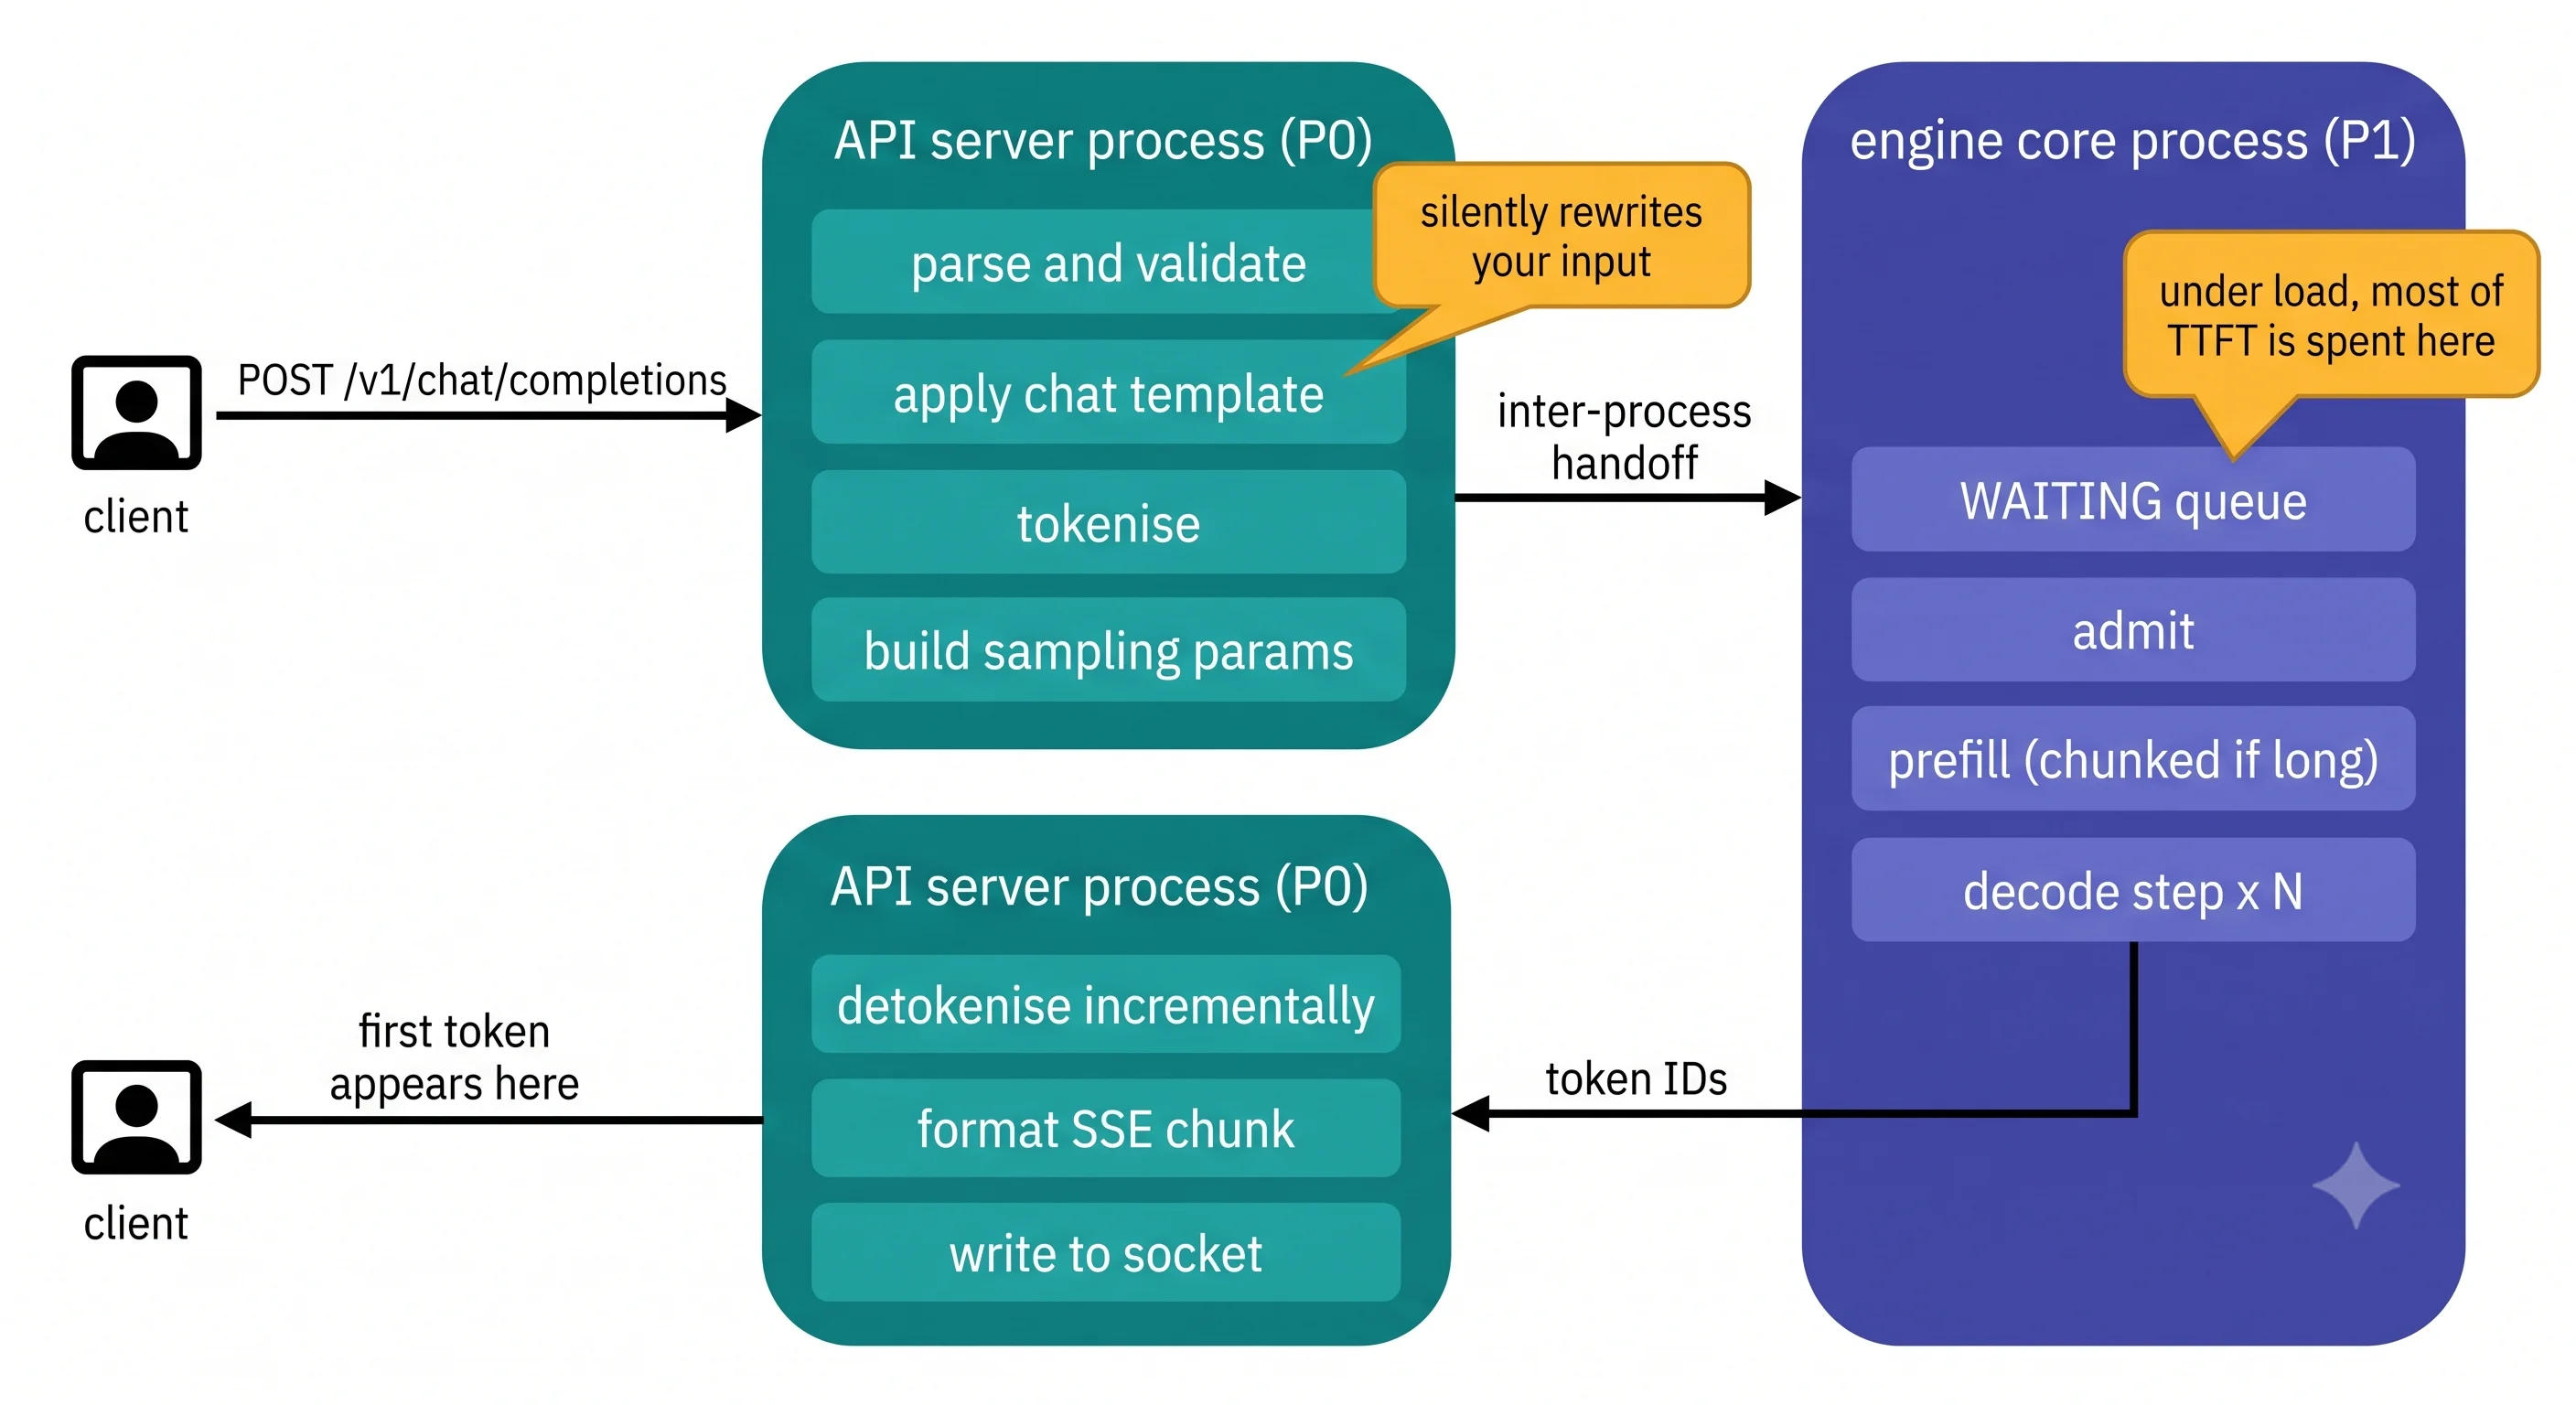
Two structural facts fall out of this diagram:
Tokenisation and detokenisation are CPU work in the API server process. They are not free, they
are on the critical path, and they scale with your traffic rather than your GPU. This is why vLLM has
an --api-server-count flag: if input processing becomes the bottleneck relative to model execution,
you scale out the API server processes, not the GPU.
The chat template runs before tokenisation and changes your text. More on that below, because it is the single most surprising step in the list.
Where the time actually goes
Decompose TTFT properly and it has three components, not one:
TTFT  =  parse + template + tokenise      (P0, CPU — small, but not zero)
       + QUEUEING                          (P1 — zero when idle, dominant under load)
       + prefill                           (P1, GPU — scales with prompt length)
       + first detokenise + SSE write      (P0 — small)
The consequence worth internalising:
| Condition | What dominates TTFT | The right fix |
|---|---|---|
| Idle server, long prompt | Prefill | Prefix caching, shorter prompts, more compute |
| Loaded server, any prompt | Queueing | More replicas, admission control |
| Idle server, short prompt, still slow | CPU-side — tokenise, template, or API server contention | More API server processes, faster tokeniser, more cores |
A TTFT number measured on an idle server tells you almost nothing about production, because the term that dominates in production is exactly the one you set to zero by testing alone. This is the most common measurement error in the whole subject, and it follows directly from the diagram.
For end-to-end latency, the arithmetic from Prefill vs Decode still holds, with the CPU terms now visible:
E2E = TTFT + (output_tokens − 1) × ITL + final detokenise/flushFor a typical chat response — short prompt, few hundred output tokens — the decode loop dominates E2E. For a RAG request — long prompt, short answer — TTFT dominates. Same server, opposite bottlenecks, which is why one "latency" number can't serve both.
The chat template: the stage nobody expects
/v1/completions sends your string to the tokeniser as-is. /v1/chat/completions does not: it takes
your list of messages and renders them through the model's chat template — a Jinja template
shipped in the model repo's tokenizer_config.json — which inserts role markers, special tokens and
frequently a default system prompt.
For Qwen2.5, the template inserts <|im_start|> / <|im_end|> markers around each turn, and if you
send no system message it adds one for you: "You are Qwen, created by Alibaba Cloud. You are a
helpful assistant."
Three consequences, all of which bite people:
- Your token count is not what you counted. Templating happens before tokenisation, so the prompt you priced is not the prompt you paid for.
- Two models with identical messages produce different prompts. The template is per-model. This is a real source of "the same prompt got worse after we switched models."
- A model update can change the template. It lives in the repo, so an unpinned revision can alter your effective prompt with no change on your side — which is the argument for pinning revisions from Anatomy of a vLLM Setup.
Cancellation: the request that should stop
When a client disconnects mid-stream, the ideal behaviour is that the engine aborts the request and returns its KV blocks to the pool. Otherwise you are generating tokens nobody will read, holding blocks that other requests need — paying twice for nothing.
This matters more than it sounds, because the traffic most likely to be cancelled (a user hitting stop on a long answer) is exactly the traffic holding the most blocks.
⚠️ Confirm your version's disconnect-abort behaviour, and — just as important — that nothing between your client and the server buffers the response. A proxy that buffers SSE will both hide the disconnect and destroy streaming; see Where It Bites You.
Try It
Hardware: Colab T4 or any CUDA GPU.
vllm serve Qwen/Qwen2.5-0.5B-Instruct --max-model-len 4096Experiment 1 — decompose TTFT into queueing and prefill
The claim is that TTFT measured idle is a different quantity from TTFT under load. Measure both.
# ttft_decompose.py — the same request, alone and under contention.
import concurrent.futures as cf, statistics, time
from openai import OpenAI

client = OpenAI(base_url="http://localhost:8000/v1", api_key="EMPTY")
MODEL  = "Qwen/Qwen2.5-0.5B-Instruct"

def ttft(prompt_tokens=512, max_tokens=64):
    prompt = "word " * prompt_tokens
    t0 = time.perf_counter()
    for chunk in client.completions.create(model=MODEL, prompt=prompt,
                                           max_tokens=max_tokens, temperature=0.0,
                                           stream=True):
        if chunk.choices[0].text:
            return time.perf_counter() - t0
    return float("nan")

def noise(_):                      # background load
    client.completions.create(model=MODEL, prompt="Write a long essay about memory.",
                              max_tokens=512, temperature=0.8)

# --- idle ---
idle = [ttft() for _ in range(10)]
print(f"idle       p50 TTFT: {statistics.median(idle)*1000:>7.0f} ms")

# --- under load ---
with cf.ThreadPoolExecutor(max_workers=32) as ex:
    bg = [ex.submit(noise, i) for i in range(32)]
    time.sleep(2)                                    # let the queue build
    loaded = [ttft() for _ in range(10)]
    for f in bg: f.cancel()
print(f"under load p50 TTFT: {statistics.median(loaded)*1000:>7.0f} ms")
print(f"queueing accounts for roughly "
      f"{(statistics.median(loaded)-statistics.median(idle))*1000:>.0f} ms")
What you should observe: idle TTFT is close to pure prefill plus CPU overhead. Loaded TTFT is several times larger, and the difference is queueing — a term that simply does not exist in your idle benchmark.
Now change one thing: re-run with prompt_tokens=64 instead of 512.
| Observation | What it proves |
|---|---|
| Idle TTFT falls noticeably with the shorter prompt | Prefill is a real component of idle TTFT and scales with prompt length |
| Loaded TTFT falls much less, proportionally | Under load you're dominated by queueing, which doesn't care how long your prompt is |
| The gap between idle and loaded barely changes | Queueing is a property of the server's saturation, not of your request |
That last row is the useful one. Queueing time is not something your request can avoid by being small — it's set by everyone else's traffic, which is why the fix is capacity rather than prompt engineering.
Experiment 2 — find out what the model actually received
No GPU needed for this one, and it takes thirty seconds.
# what_the_model_saw.py — the chat template, made visible.
from transformers import AutoTokenizer

tok = AutoTokenizer.from_pretrained("Qwen/Qwen2.5-0.5B-Instruct")
messages = [{"role": "user", "content": "Hello."}]

rendered = tok.apply_chat_template(messages, tokenize=False, add_generation_prompt=True)
print("--- what you sent ---")
print(repr(messages[0]["content"]))
print(f"    {len(tok.encode(messages[0]['content']))} tokens")
print("--- what the model saw ---")
print(rendered)
print(f"    {len(tok.apply_chat_template(messages, add_generation_prompt=True))} tokens")
What you should observe: a five-character user message becomes a multi-line prompt containing
<|im_start|> / <|im_end|> markers and a system prompt you never wrote — Qwen2.5's template
inserts "You are Qwen, created by Alibaba Cloud. You are a helpful assistant." when you don't supply
one. The token count is several times your input.
Then change one thing: add your own {"role": "system", ...} message and re-render. The default
disappears, replaced by yours.
Why this matters operationally: every token in that rendered string occupies KV cache and counts
toward max_model_len. If you are doing capacity arithmetic from
The KV Cache using raw user input lengths, you are
underestimating — and for short messages, underestimating by a lot.
Dial It In
| Knob | What it controls | When to move it |
|---|---|---|
--api-server-count |
Number of API server processes doing parsing, templating, tokenisation | Input processing is the bottleneck and you have spare CPU. Online serving only |
VLLM_USE_FASTOKENS=1 |
Swaps the HF fast tokeniser for a Rust backend on BPE tokenisers (Qwen, Llama, DeepSeek…) | Tokeniser-bound workloads: long shared prefixes, bursty short prompts, heavy batch detokenisation. No effect if you're GPU-bound |
--served-model-name |
The name clients use in model |
Always in production, so the checkpoint can change without touching clients |
--max-log-len |
Truncates prompts in request logs | Long prompts are flooding your logs, or they contain sensitive text |
| Chat template | Which template renders your messages | Rarely override it — but always know what it does |
detokenize=False |
Skips detokenisation (offline LLM only) |
Benchmarking raw generation, where you don't need the text |
The one worth knowing about: --api-server-count. It exists because the API server and engine
core are separate processes, so P0 can saturate while P1 has capacity. The symptom is low GPU
utilisation with bad latency and a healthy-looking scheduler — and no GPU-side flag will fix it.
⚠️ If you scale out API servers, note the interaction with multi-modal IPC caching, which requires a one-to-one correspondence between API and engine core processes. Also consider
VLLM_MEDIA_LOADING_THREAD_COUNT— each API server uses several threads to load media, and they multiply.
Where It Bites You
Measuring latency at the wrong boundary. Server-side request duration excludes queueing at your load balancer, TLS, and the network. Client-side excludes nothing but tells you nothing about where. You need both, joined by a request ID, or you will spend an afternoon arguing about whose number is right.
Benchmarking TTFT on an idle server. Idle TTFT contains no queueing, and queueing is what dominates in production. A number produced this way is not a smaller version of the production number — it's a different quantity.
Forgetting the chat template exists. Your token counts, your cost model and your
max_model_len headroom are all computed on text the model never saw. And when a model update
changes the template under you, the symptom is "quality regressed" with no code change to point at.
Assuming a disconnected client stops the work. If cancellation isn't propagating — often because a proxy is buffering — you generate hundreds of tokens into a void while holding KV blocks. This is worst precisely when it hurts most: long answers users gave up on.
A proxy that buffers SSE. nginx and several ingress controllers buffer responses by default, which converts your token-by-token stream into one delivery at the end. TTFT as the user experiences it becomes E2E, and every streaming benefit disappears — while every server-side metric still looks perfect.
Ignoring CPU provisioning. From the scheduler page: there
are 2 + N processes minimum, and tokenisation, detokenisation and streaming all consume CPU. Under-
provision and you get the low-GPU-utilisation-with-bad-latency signature, which people almost always
misdiagnose as a GPU problem.
Detokenising naively when streaming. Tokens don't align to character boundaries — a multi-byte UTF-8 character can span two tokens, and emitting each token's decoded text independently produces mojibake. vLLM handles this incrementally; if you're building your own client-side reassembly, don't decode per-chunk in isolation.
In Production
Instrument the stages, not the total. A single latency histogram tells you something is wrong. A breakdown — queue time, prefill, decode, detokenise — tells you what to do. At minimum, separate queueing from execution, because they have completely different fixes (capacity versus tuning).
Propagate a request ID end to end. Client → load balancer → API server → engine core → logs. It is the only way to reconcile the two latency numbers in Where It Bites You, and it's the difference between "some requests are slow" and "these requests are slow, here's the stage."
Log request bodies deliberately, not accidentally. Prompts are user content: they may contain
personal data, and they are large. Decide explicitly what's logged, use --max-log-len to truncate,
and treat prompt logs as sensitive by default. See
Security Posture.
Configure your proxy for streaming before you launch, not after. Disable response buffering, raise idle timeouts beyond your longest generation, and verify by watching a real stream through the full path — not against the server directly. The failure is invisible in server-side metrics.
What changes at 10× traffic. The GPU stages behave as the scheduler page describes. What changes disproportionately is everything on the CPU side: tokenisation load rises linearly with requests, detokenisation and SSE writes rise with tokens, and the queue term in TTFT grows non-linearly as arrival rate approaches service rate. Teams that scaled GPUs and not API servers discover this as a latency wall with an idle-looking GPU.
Check Yourself
Recall the idea
Name the stages a request passes through, and which process each runs in.
In the API server process (P0): parse and validate, apply the chat template, tokenise, build sampling params. In the engine core process (P1): enter the waiting queue, get admitted, prefill, then N decode steps. Back in P0: incremental detokenisation, SSE formatting, socket write.
What are the three components of TTFT?
CPU-side preparation (parse, template, tokenise), queueing time, and prefill — plus a small detokenise-and-write at the end. Queueing is zero on an idle server and dominant under load, which is why idle TTFT measurements mislead.
What does the chat template do, and when does it run?
It renders your message list into a single string using a Jinja template from the model repo, inserting role markers, special tokens and often a default system prompt. It runs in the API server before tokenisation, so it changes the token count you thought you were sending.
Why does --api-server-count exist?
Because the API server and engine core are separate processes, and input processing (parsing, templating, tokenisation) can bottleneck while the GPU still has capacity. Scaling API server processes fixes that; no GPU-side flag will.
Explain the mechanics
Server-side duration says 180 ms; the user says two seconds. List the possible causes.
Everything outside the span you measured: load-balancer queueing, TLS and connection setup, network latency, and — most commonly — a proxy buffering the SSE stream so the user receives everything at the end rather than progressively. Also check whether your server-side metric starts at admission rather than arrival, which would exclude vLLM's own queue time.
Why is idle TTFT a poor predictor of production TTFT?
Because it omits queueing, the term that dominates under load. Idle TTFT ≈ CPU prep + prefill. Production TTFT adds a queue term that grows non-linearly with utilisation and is independent of your request's size. The two are different quantities, not different magnitudes of the same one.
A 5-token user message becomes a 30-token prompt. Where did the tokens come from?
The chat template: role markers such as <|im_start|> and <|im_end|> around each turn, the
generation prompt appended at the end, and — if you sent no system message — a model-default system
prompt inserted for you. All of it occupies KV cache and counts against max_model_len.
Why can't you detokenise a stream one token at a time in isolation?
Because token boundaries don't align with character boundaries: a multi-byte UTF-8 character can be split across two tokens, so decoding each token independently yields replacement characters or mojibake. Streaming detokenisation has to carry state across tokens.
Reason about a trade-off
Low GPU utilisation, bad latency, scheduler shows a short queue and no preemption. Diagnose.
This is the CPU-side signature. The scheduler isn't the constraint — it's not preempting and not
backed up — so the time is going somewhere P1 can't see. Candidates in order: too few physical cores
for the 2 + N processes, so the engine core's busy loop is starved; API server saturation on
tokenisation and templating; or a buffering proxy making it look slow to users while the server is
fine. Check core count first (cheapest), then try --api-server-count, and verify streaming through
the full network path rather than against the server.
Is it worth enabling the Rust tokeniser backend?
It depends entirely on whether you're tokeniser-bound, which is a minority of deployments. It's worth it when you have long shared prefixes, bursty short prompts, or heavy batch detokenisation — cases where CPU-side text processing is a real fraction of the work. It's pointless when you're GPU-bound on prefill or decode, which is the common case; the change won't be visible end to end. Measure P0 CPU utilisation before adopting it.
Should cancellation be handled at the gateway or the engine?
Both, doing different jobs. The engine must abort on disconnect so blocks are freed — that's pure waste otherwise, and it's worst for exactly the long generations users abandon. The gateway must actually propagate the disconnect rather than buffering the response and holding the upstream connection open. A correct engine behind a buffering proxy still burns GPU on abandoned requests, which is why this is a path property rather than a server setting.
Your RAG service and your chat service share a cluster and you have one latency SLO. What's wrong?
They have opposite bottlenecks. RAG is long-prompt, short-answer, so its latency is TTFT-dominated — prefill and prefix caching are the levers. Chat is short-prompt, long-answer, so its latency is decode-dominated and driven by ITL and batch size. A single SLO will either be trivially met by one and impossible for the other, or will drive tuning that hurts both. Separate the SLOs; consider separate pools if the mix is bad enough.
Cheat Sheet
The path
CLIENT → [P0: parse → chat template → tokenise] → [P1: queue → admit → prefill → decode ×N]
       → [P0: detokenise → SSE chunk → socket] → CLIENT
TTFT decomposed
TTFT = CPU prep (parse + template + tokenise)   ← P0
     + QUEUEING                                  ← P1, zero when idle, dominant under load
     + prefill                                   ← P1, scales with prompt length
+ first detokenise + write ← P0| Symptom | Dominant term | Fix |
|---|---|---|
| Slow, idle server, long prompt | Prefill | Prefix caching, shorter prompts, more compute |
| Slow, loaded server | Queueing | More replicas, admission control |
| Slow, idle server, short prompt | CPU-side | More cores, --api-server-count, faster tokeniser |
| Server fast, user slow | Outside the span | Buffering proxy, network, LB queue |
Facts worth remembering
| Fact | Consequence |
|---|---|
| Tokenise/detokenise run in the API server, not the engine | CPU can bottleneck while the GPU idles |
| The chat template runs before tokenisation | Your token count is not what you counted |
| Qwen2.5 inserts a default system prompt if you send none | Short messages cost several times their apparent length |
| Templates live in the model repo | An unpinned revision can change your prompt silently |
| Idle TTFT contains no queueing | It is a different quantity from production TTFT |
Flags
--api-server-count 4          # scale input processing independently of the GPU
VLLM_USE_FASTOKENS=1          # Rust tokeniser for BPE models; only helps if tokeniser-bound
--max-log-len 200             # truncate prompts in logs (they're user content)
--served-model-name chat      # stable client-facing name
Sources
- vLLM, Optimization and Tuning — API server scale-out,
VLLM_USE_FASTOKENS, multi-modal caching, CPU provisioning — github.com/vllm-project/vllm/blob/main/docs/configuration/optimization - Qwen2.5-0.5B-Instruct
tokenizer_config.json— the chat template quoted here — huggingface.co/Qwen/Qwen2.5-0.5B-Instruct
← Previous: The Scheduler & Block Manager · Next: Prefix Caching →
⚠️ Verification checklist (delete before publishing)
Verified this session
- The
2 + Nprocess architecture (1 API server + 1 engine core + N GPU workers) and the P0/P1 naming are from vLLM's optimisation docs. -
--api-server-countexists, is online-inference only, and disables multi-modal IPC caching because that requires 1:1 API-to-engine-core correspondence. -
VLLM_USE_FASTOKENS=1and its stated applicability (BPE tokenisers; tokeniser-bound workloads; no gain if GPU-bound) are documented. -
VLLM_MEDIA_LOADING_THREAD_COUNTand the 8-threads-per-API-server default are documented. - Qwen2.5's chat template inserts
<|im_start|>/<|im_end|>and a default system prompt ("You are Qwen, created by Alibaba Cloud. You are a helpful assistant.") when no system message is supplied — read from the model'stokenizer_config.json.
Needs verifying
- Client-disconnect abort behaviour. The page asserts the engine should abort and free blocks on disconnect, and flags it inline. Confirm what the current version actually does — this is also asserted on The KV Cache and both must agree.
- Confirm the exact ordering inside P0 — specifically that templating precedes tokenisation (near-certain, but stated as fact).
- Confirm
--max-log-lenexists with that name and semantics. - Confirm
detokenize=Falseis still available on the offlineLLMpath. - Confirm incremental detokenisation handles multi-byte UTF-8 across token boundaries as described.
- Confirm whether the engine reports queue time separately in its metrics — the In Production advice to "separate queueing from execution" depends on that being available rather than requiring client-side inference.
Code
- Run
ttft_decompose.pyon a T4 and capture idle vs loaded p50 TTFT. The claim most at risk: that the idle-to-loaded gap barely changes when the prompt shrinks. If it moves a lot, queueing and prefill are less separable than the page implies. -
for f in bg: f.cancel()won't stop already-running futures — the background load may continue past the measurement. Either accept it and note it, or restructure with an explicit stop event. -
"word " * nagain gives approximately, not exactly,ntokens. Same fix as Prefill vs Decode. - Run
what_the_model_saw.pyand paste the real rendered output into the page — currently described rather than shown. - Confirm
apply_chat_template(..., tokenize=False)and the token-count call behave as used on the pinnedtransformersversion.
Rendering
- One image generated and placed; row added to
image-prompts.md. - The ASCII pipeline block renders correctly on the published site (it uses box-drawing characters).
- All relative links resolve once target files exist.