
Estimation Techniques
In a Nutshell
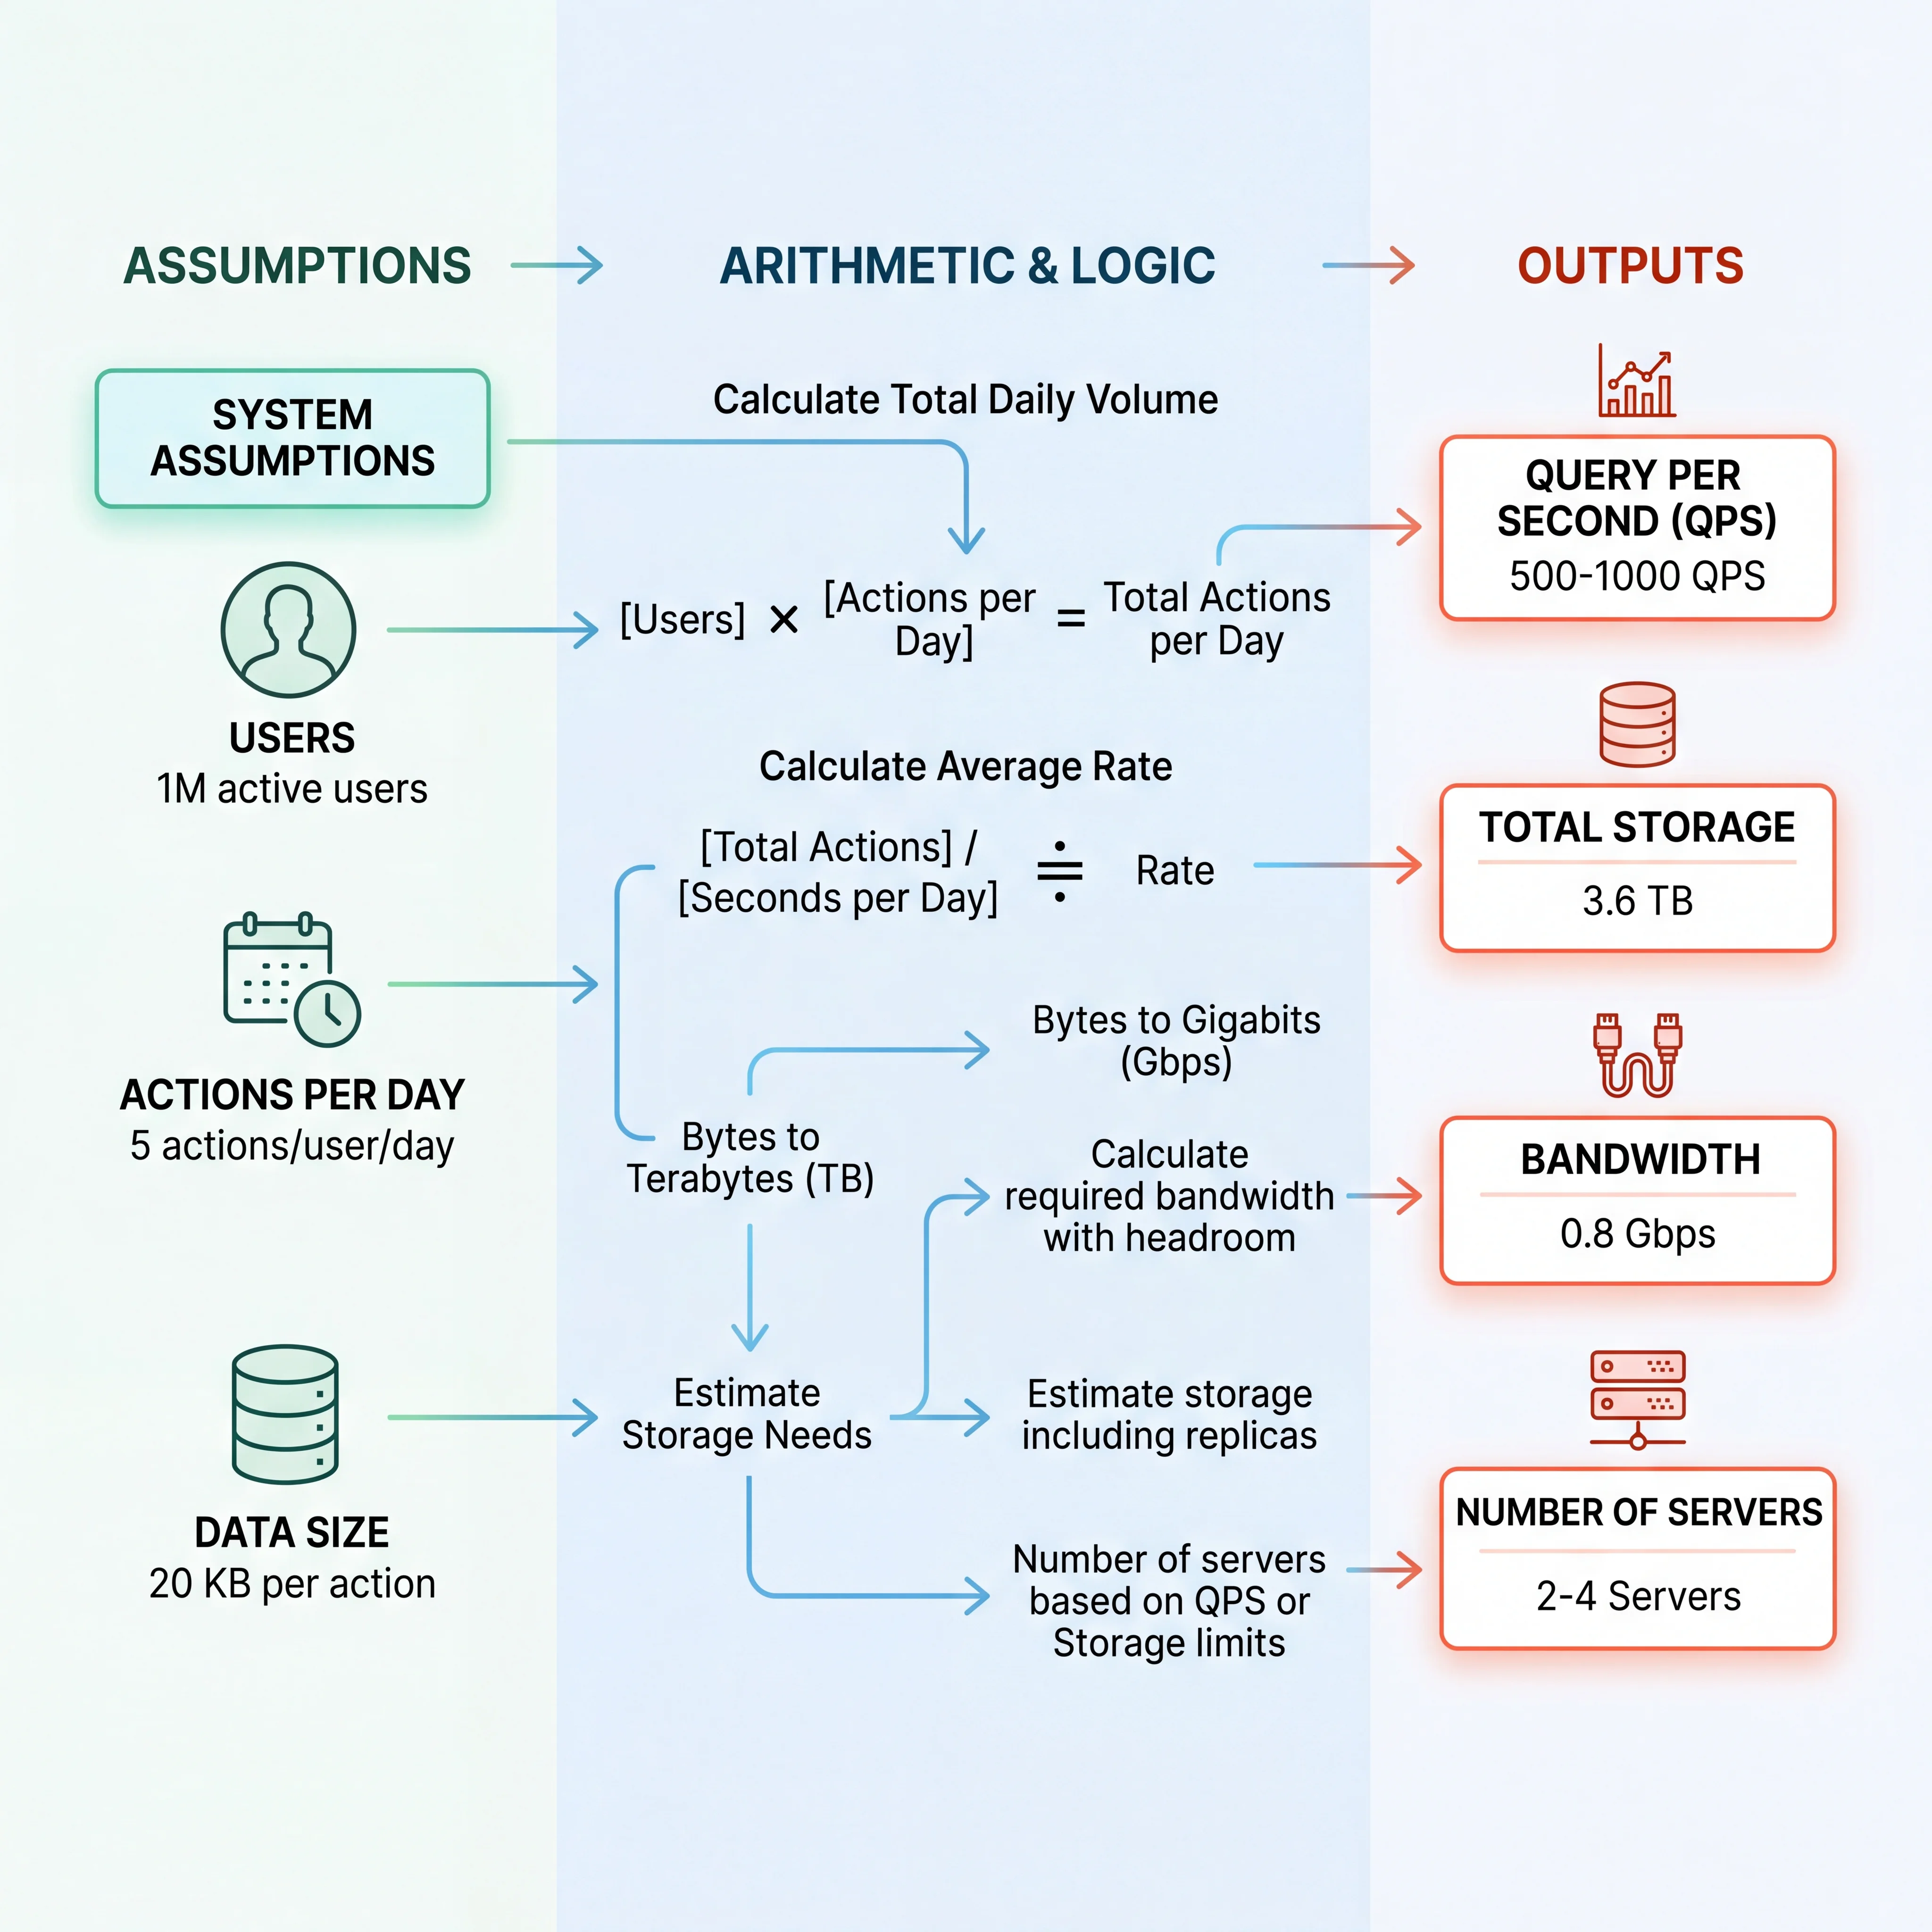
Back-of-the-envelope estimation is the art of turning vague assumptions into concrete numbers that justify (or kill) an architecture. If you know how many users you have, how often they do things, and how big each thing is, you can calculate the QPS (queries per second), storage, bandwidth, and memory your system needs. These numbers are the bridge between "I think we need a cache" and "we need a cache because our database can't handle 115K read QPS."
How It Actually Works
The Core Formula
Almost every estimation follows the same pattern:
Total operations = Number of users × Actions per user per day
QPS (average)    = Total operations / 86,400 (seconds in a day)
QPS (peak)       = QPS (average) × Peak multiplier (typically 2–5×)
For storage:
Storage per year = Total operations per day × Size per operation × 365For bandwidth:
Bandwidth = QPS × Size per operationNumbers Every Engineer Should Know
These are the reference constants you should have memorized for quick estimation:
| What | Value |
|---|---|
| Seconds in a day | |
| Seconds in a month | ~2.5 million |
| Seconds in a year | ~31.5 million |
| 1 million requests/day | ~12 QPS |
| 1 billion requests/day | ~12,000 QPS |
| 1 KB | A short text post or tweet |
| 1 MB | A high-res photo |
| 1 GB | ~1,000 high-res photos |
| 1 TB | ~1 million high-res photos |
| 1 PB | ~1,000 TB |
Latency numbers:
| Operation | Approximate Time |
|---|---|
| L1 cache reference | 0.5 ns |
| RAM reference | 100 ns |
| SSD random read | 150 μs |
| HDD seek | 10 ms |
| Same-datacenter round trip | 0.5 ms |
| Cross-continent round trip | 150 ms |
These help you reason about where bottlenecks will be without running benchmarks.
The Step-by-Step Process
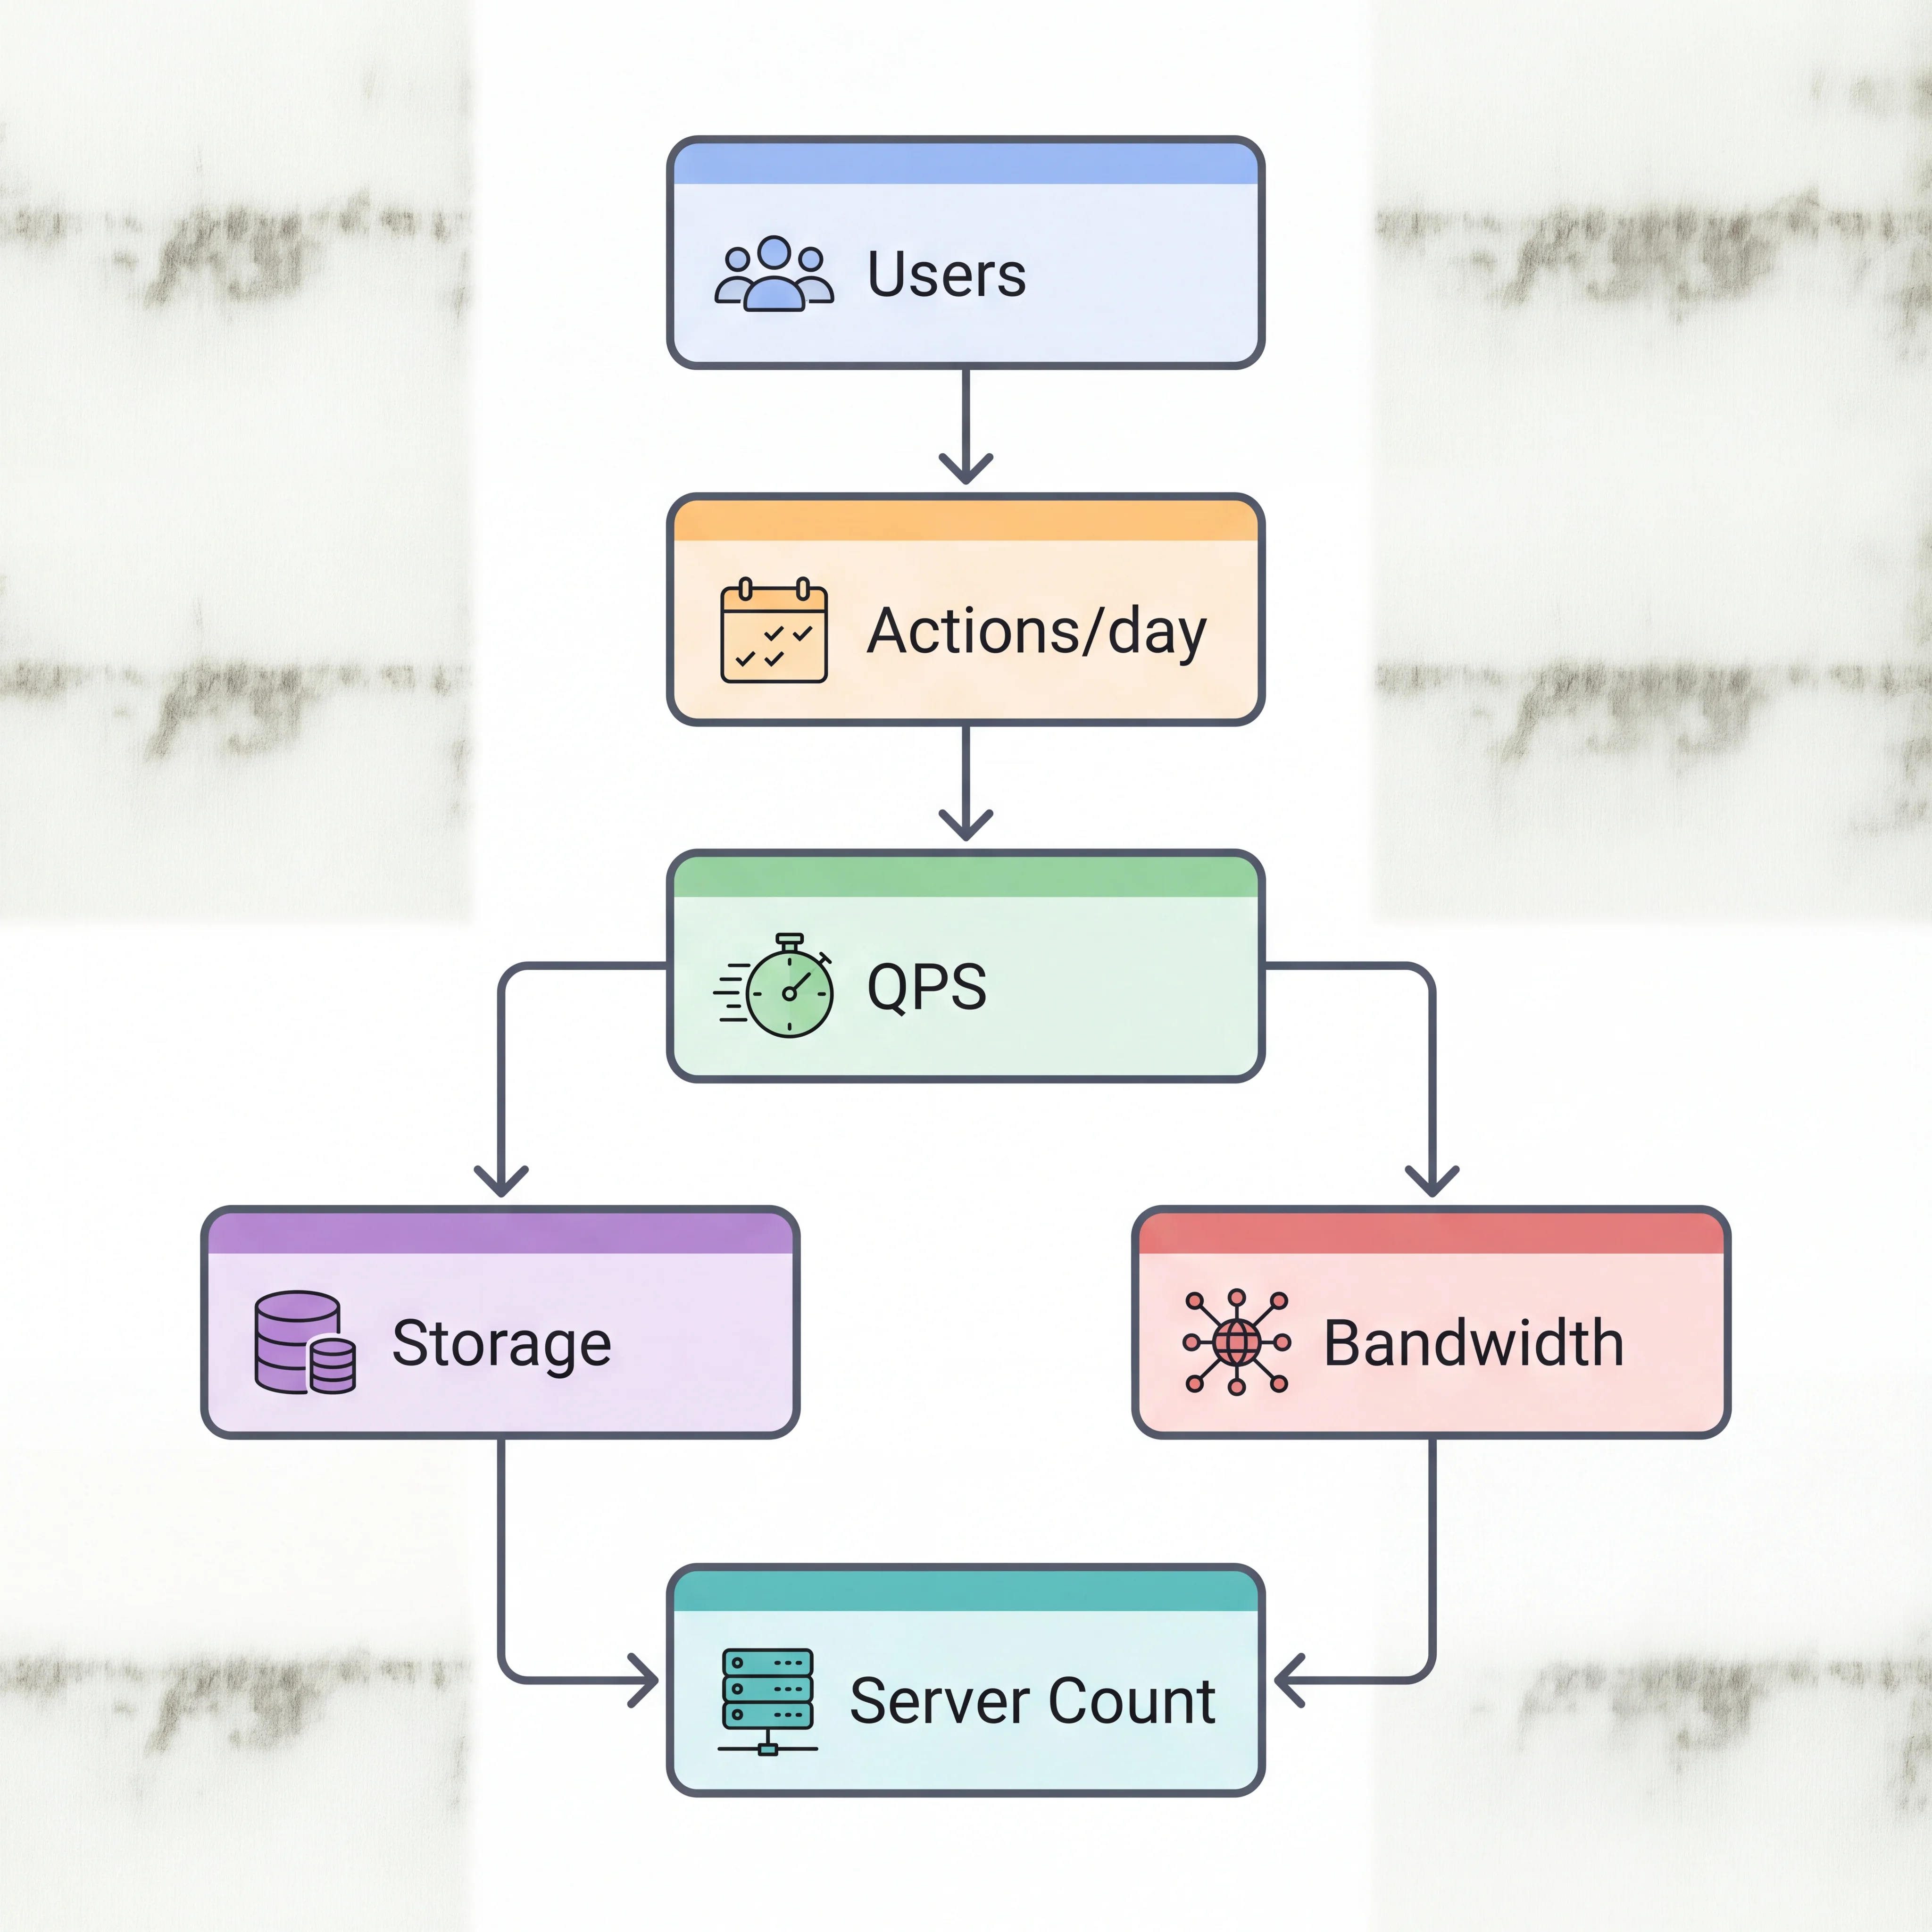
- Start with users — How many DAU (daily active users)?
- Estimate actions — How many times does each user do the key action per day?
- Calculate QPS — Divide by 86,400. Multiply by peak factor.
- Estimate data size — How big is each piece of data (post, message, image)?
- Calculate storage — Operations × size × retention period
- Calculate bandwidth — QPS × size per request (for both ingress and egress)
- Derive server count — If one server handles X QPS, you need total QPS / X servers
Rounding Rules
In estimation, precision is the enemy:
- Use powers of 2 and powers of 10 freely
- Round 86,400 to 100,000 — nobody will argue
- Round 2.5 million to 3 million — the order of magnitude is what matters
- If you get 347 servers, say "about 350–400 servers" — don't pretend the 7 matters
The goal is to land in the right order of magnitude. Knowing you need ~100 servers vs ~10,000 servers is what drives architecture — not whether it's 97 or 103.
Seeing It in Action
Scenario: Estimate the infrastructure for a Twitter-like social media platform.
Given assumptions:
- 500M daily active users (DAU)
- Each user reads 20 posts/day on average
- Each user writes 2 posts/day on average
- Average post size: 1 KB (text + metadata)
- 20% of posts include an image (~200 KB average)
Reads:
Read QPS = 500M × 20 / 100K = 100,000 QPS (average)
Peak read QPS = 100K × 3 = 300,000 QPS
Writes:
Write QPS = 500M × 2 / 100K = 10,000 QPS (average)
Peak write QPS = 10K × 3 = 30,000 QPS
Read/Write ratio: 100K / 10K = 10:1 → read-heavy system → invest in caching
Storage (text, 5 years):
Posts/day = 500M × 2 = 1 billion posts/day
Text storage = 1B × 1 KB = 1 TB/day
5-year text storage = 1 TB × 365 × 5 ≈ 1.8 PB
Storage (images, 5 years):
Images/day = 1B × 0.2 = 200M images/day
Image storage = 200M × 200 KB = 40 TB/day
5-year image storage = 40 TB × 365 × 5 ≈ 73 PB
Key takeaways from the numbers:
- 300K peak read QPS → a single database can't handle this → need caching (Redis/Memcached) and read replicas
- 1.8 PB text → need distributed storage and partitioning
- 73 PB images → must use object storage (S3/GCS), not a database
- 10:1 read/write ratio → cache-friendly, invest heavily in caching layer
Interview Questions
Q: Walk me through a back-of-the-envelope calculation for a URL shortener handling 100M new URLs per month. Hint: 100M/month ÷ 2.5M seconds/month ≈ 40 write QPS. If read:write is 100:1, that's 4,000 read QPS. Each URL entry is ~500 bytes (short code + long URL + metadata). Storage for 5 years: 100M × 12 × 5 × 500B = 3 TB. Very manageable — single database with caching.
Q: Why do we calculate peak QPS separately from average QPS? What happens if you only design for the average? Hint: Traffic is bursty — events, marketing campaigns, viral content can cause 3–10× spikes. If you design for average QPS, peak traffic overwhelms your system. The gap between average and peak determines how much auto-scaling headroom or queue buffering you need.
Q: You've estimated 50K QPS for reads. How do you decide how many application servers you need? Hint: Benchmark one server (say it handles 1,000 QPS). 50K / 1K = 50 servers. Add 20–30% headroom for spikes = ~65 servers. Factor in health checks, rolling deploys (need spare capacity), and failure tolerance (lose a server without impact).
Q: How would your storage estimate change if you need to keep an audit log of every action (not just posts)? Hint: Audit logs are append-only and high-volume (every read, write, login, API call). For 500M DAU each making ~100 actions/day, that's 50B events/day. Even at 200 bytes each, that's 10 TB/day — dwarfing the post storage. You'd use a columnar format (Parquet) on object storage with lifecycle policies.
Q: When is a back-of-the-envelope estimate wrong enough to matter? How do you know if your estimate is off? Hint: An order-of-magnitude error matters — thinking you need 10 servers when you need 1,000 leads to a fundamentally different architecture. Being off by 2× usually doesn't. Validate estimates against known systems (Twitter publishes its scale numbers) and refine with actual load testing before launch.
References
- System Design Interview – An Insider's Guide by Alex Xu — Chapter 2: Back-of-the-envelope Estimation
- Jeff Dean's Latency Numbers Every Programmer Should Know — interactive latency reference
- Designing Data-Intensive Applications by Martin Kleppmann — Chapter 1 on describing load and performance
Dive Deeper
- The Art of Capacity Planning by John Allspaw — the definitive book on estimation and capacity for production systems
- Napkin Math by Simon Eskildsen — practical estimation framework with real-world examples
- ByteByteGo — Capacity Estimation — video walkthrough of estimation for system design interviews