
Sequence Diagram
In a Nutshell
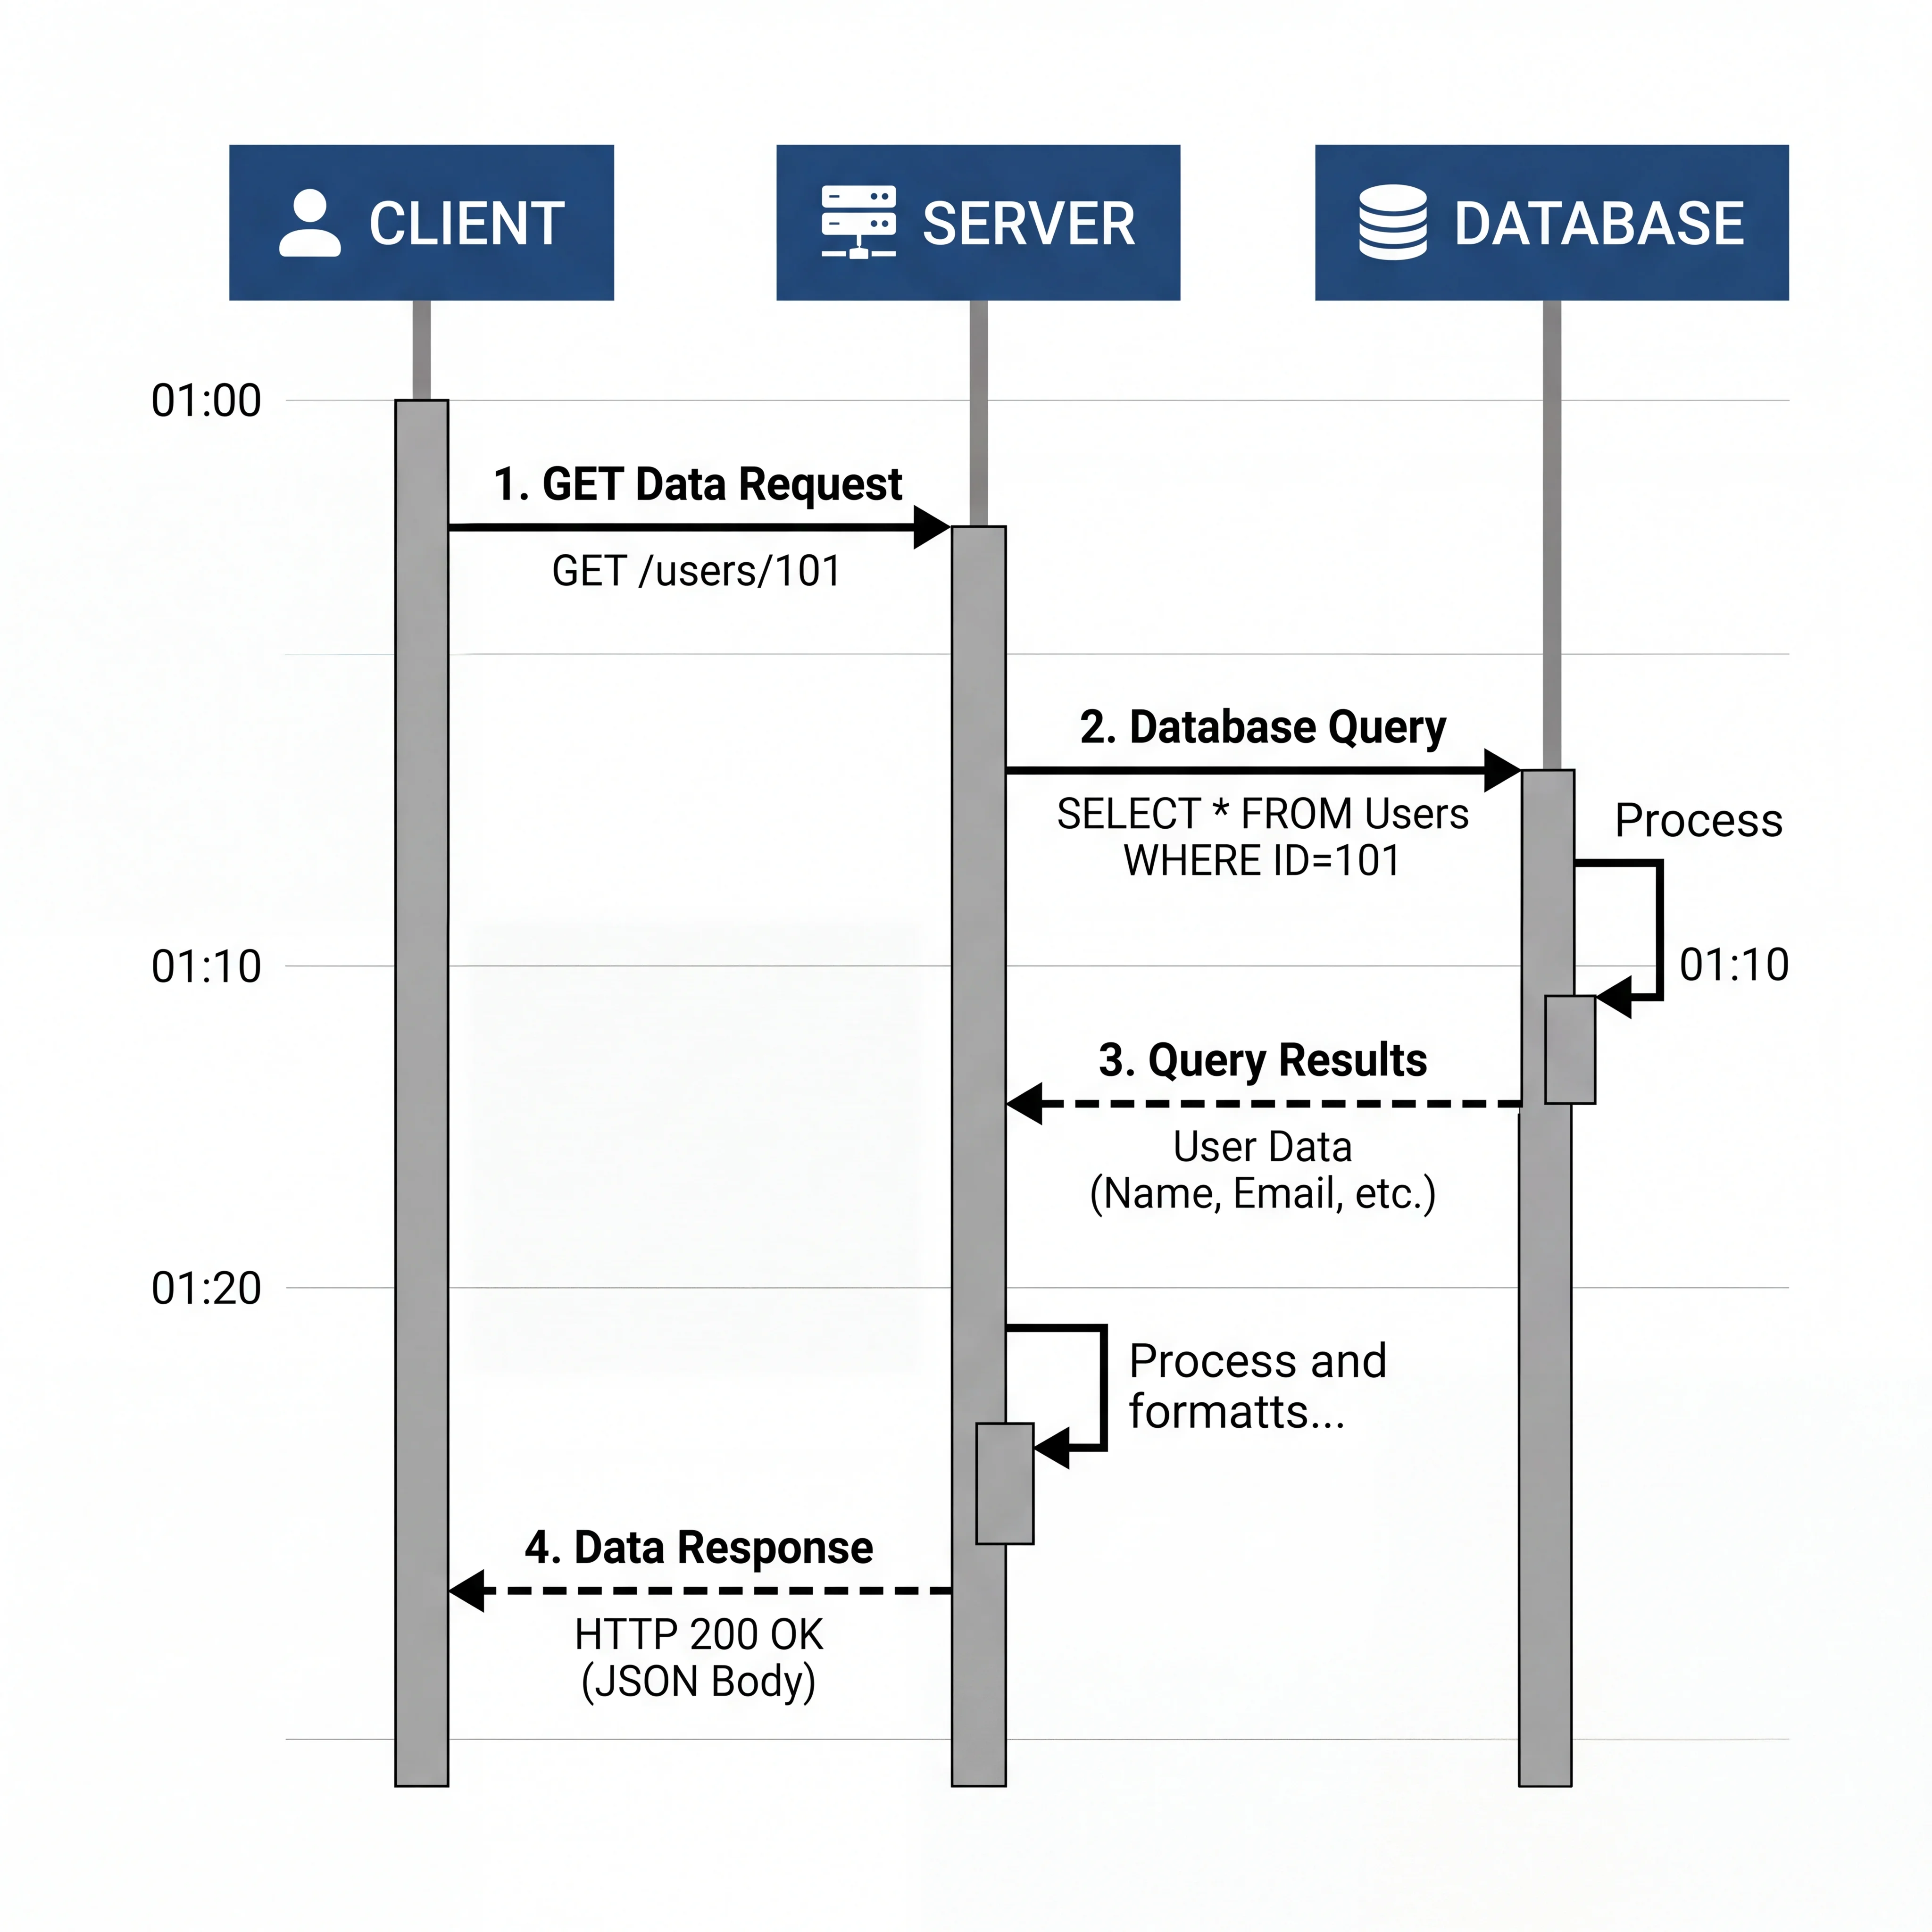
A sequence diagram shows the ordered messages between actors over time. While an architecture diagram shows you what components exist, a sequence diagram shows you what happens when — the exact order of requests, responses, and events during a specific operation. It's the most useful diagram for pinning down multi-step interactions like authentication handshakes, payment flows, retry logic, or any scenario where timing and ordering matter.
How It Actually Works
Anatomy of a Sequence Diagram
| Element | Representation | Meaning |
|---|---|---|
| Actor/Participant | Box at the top with a vertical dashed line (lifeline) | A component or role in the interaction |
| Message (sync) | Solid arrow → | A request that blocks until a response |
| Response | Dashed arrow ← | The reply to a synchronous request |
| Async message | Open arrowhead → | A fire-and-forget message (no blocking) |
| Self-call | Arrow looping back to same lifeline | Internal processing or method call |
| Activation bar | Thin rectangle on the lifeline | The period when a component is actively processing |
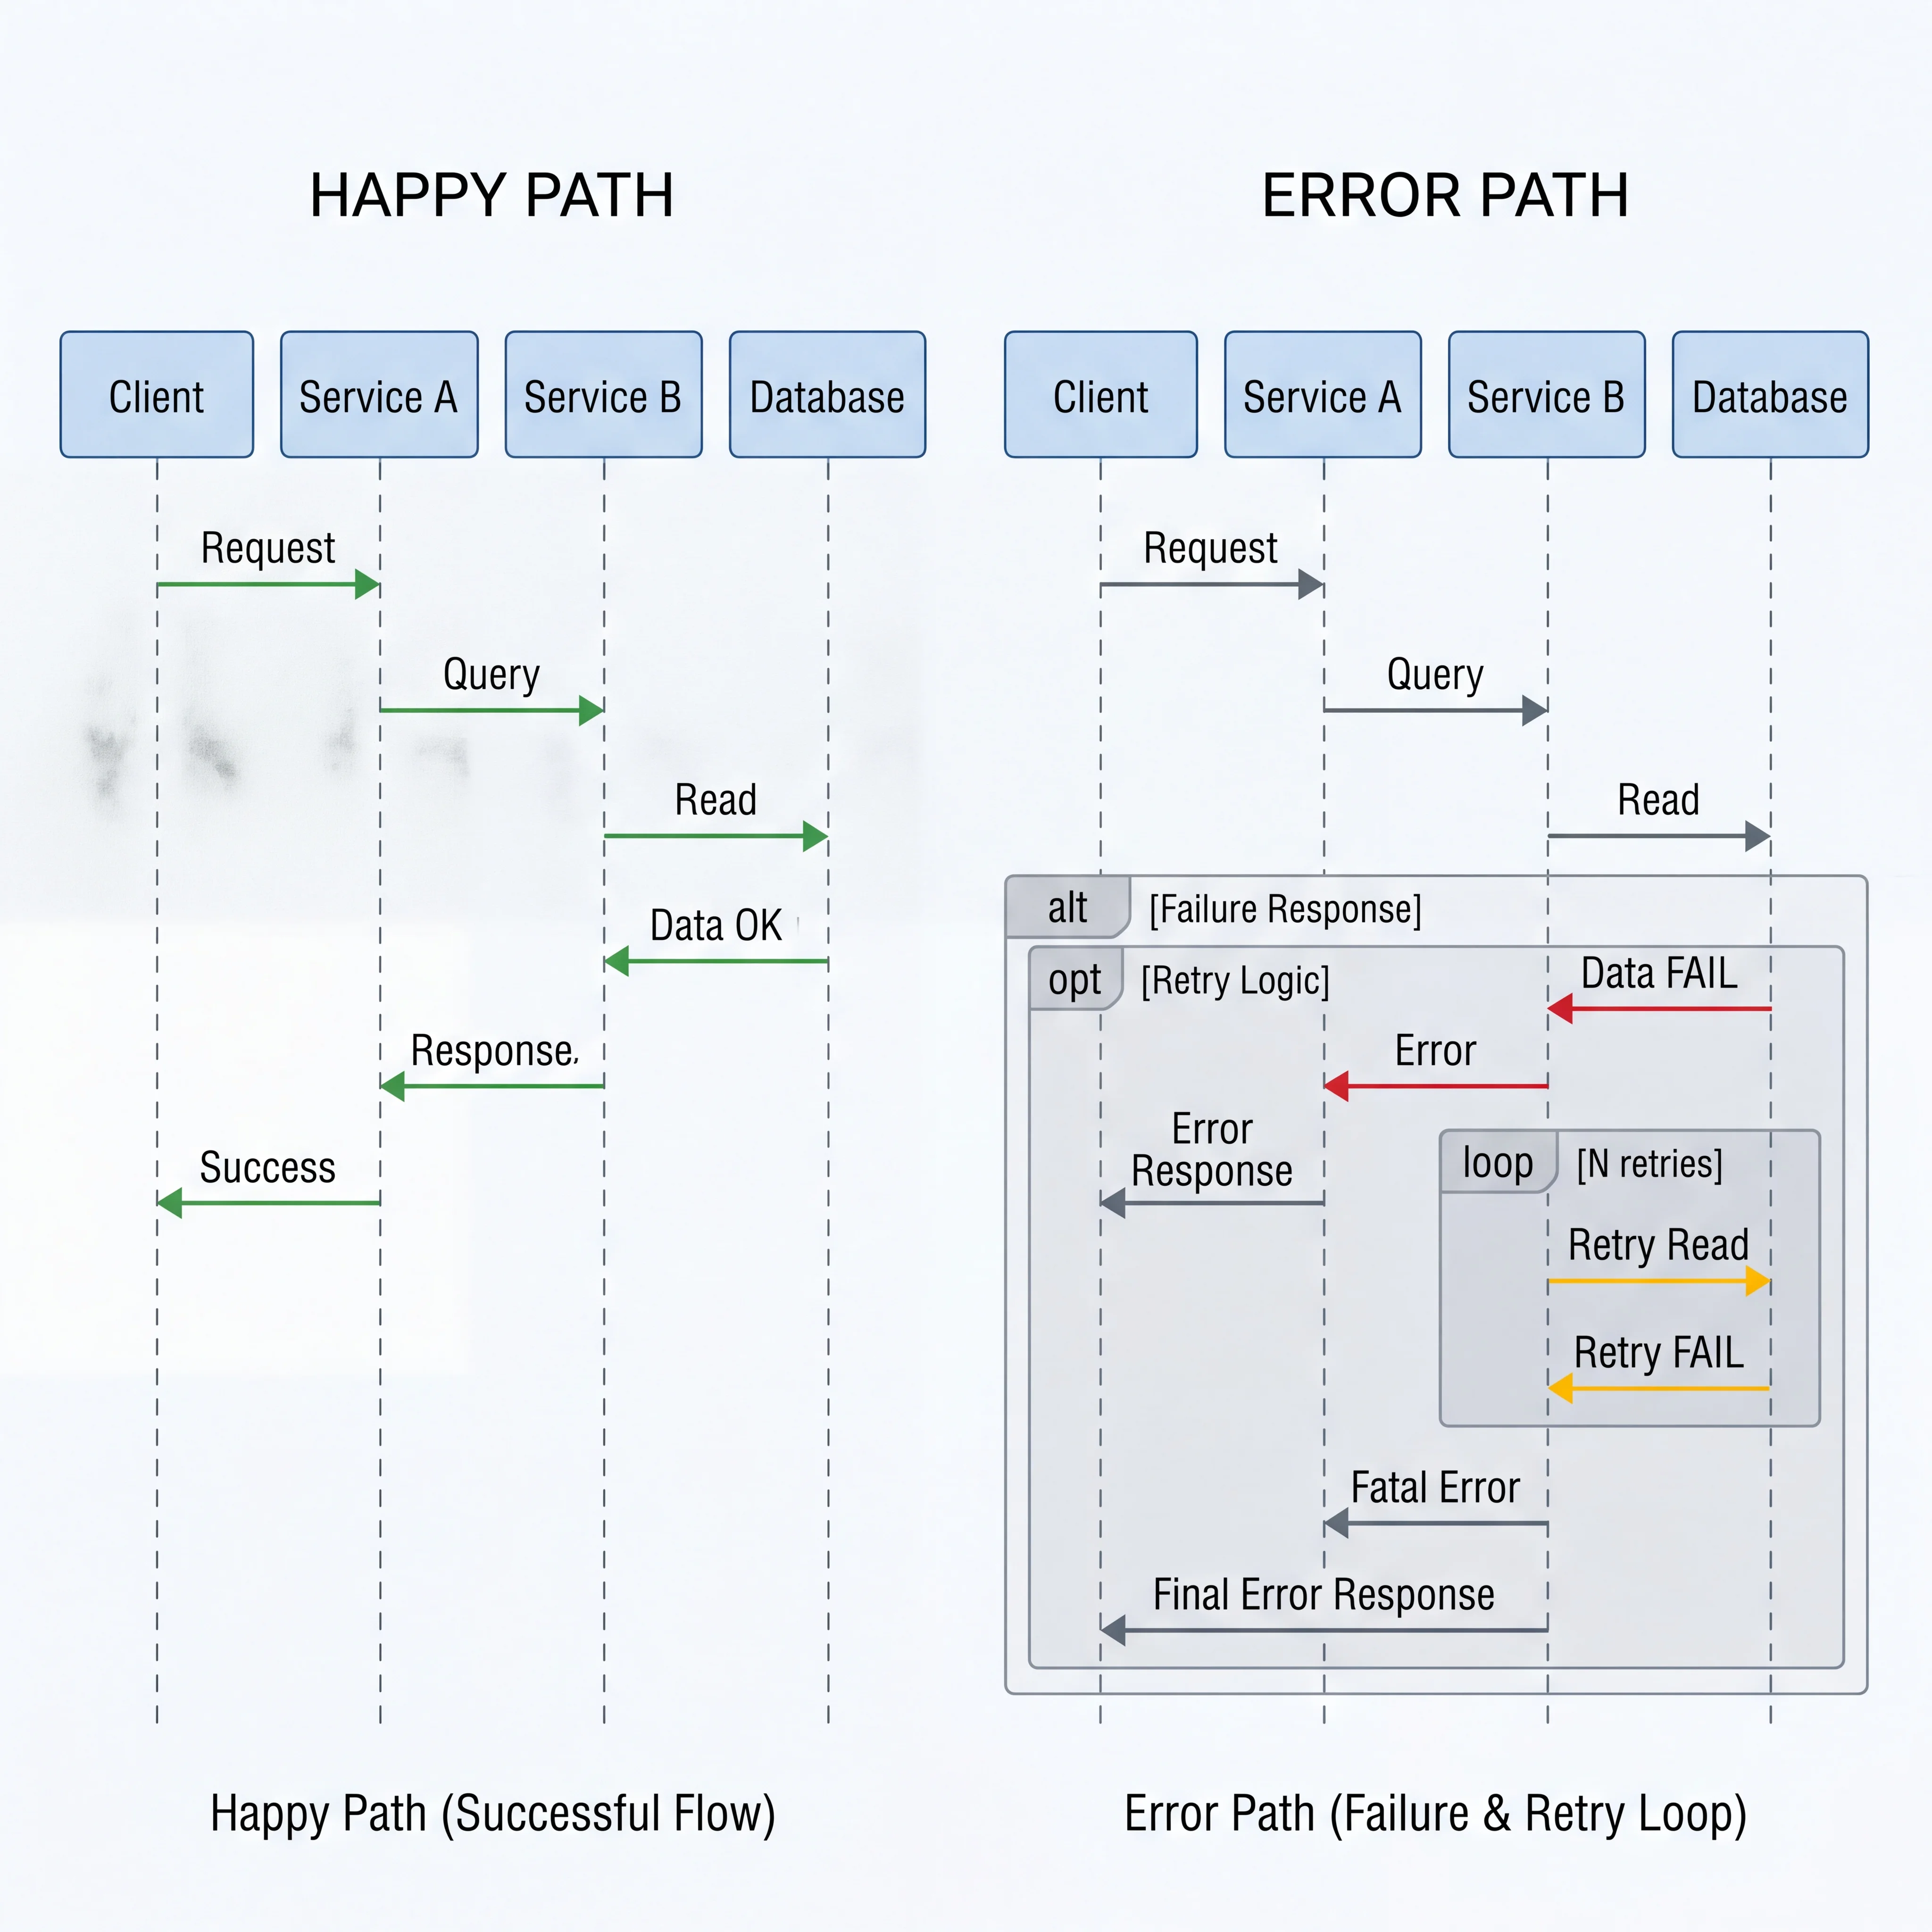
| Alt/Opt/Loop | Labeled rectangle around a group of messages | Conditional (alt), optional (opt), or repeated (loop) interactions |
When Sequence Diagrams Shine
- Multi-service interactions — When a single user action triggers calls across 3+ services
- Retry and failure scenarios — Showing what happens when step 3 of 5 fails
- Consistency windows — Making visible the gap between a write and when a read sees it
- Authentication flows — OAuth handshakes, token refresh, session management
- Async processing — Showing a queue between producer and consumer, with the time gap visible
How to Draw One
- Identify the trigger — What user action starts this flow? ("User clicks 'Place Order'")
- List the participants — Which components are involved? (Client, API Gateway, Order Service, Payment Service, Database, Kafka)
- Trace the happy path first — Draw the messages in order for the success case
- Add error/alternative paths — Use
altblocks for conditional paths (payment succeeds vs fails) - Show async clearly — If a message goes to a queue and is processed later, make the time gap visible
Common Mistakes
- Too many participants — If you have more than 6–7 lifelines, the diagram becomes unreadable. Group services or show a higher level of abstraction.
- Missing responses — Every synchronous request should show a response arrow. A missing response means you haven't thought about what the caller gets back.
- Not showing async gaps — If a message goes to Kafka and is processed 500ms later, show the time gap. This is where eventual consistency lives.
- Using them for everything — Sequence diagrams show one specific interaction. They don't show the whole system — that's the architecture diagram's job.
Seeing It in Action
Scenario: Sequence diagram for placing an order with payment
Client          API Gateway      Order Service     Payment Service    Database         Kafka
  │                  │                 │                  │               │               │
  │  POST /orders    │                 │                  │               │               │
  │─────────────────▶│                 │                  │               │               │
  │                  │  createOrder()  │                  │               │               │
  │                  │────────────────▶│                  │               │               │
  │                  │                 │  save(order,     │               │               │
  │                  │                 │  status=PENDING) │               │               │
  │                  │                 │──────────────────┼──────────────▶│               │
  │                  │                 │     saved        │               │               │
  │                  │                 │◀─────────────────┼───────────────│               │
  │                  │                 │                  │               │               │
  │                  │                 │  chargeCard()    │               │               │
  │                  │                 │─────────────────▶│               │               │
  │                  │                 │                  │               │               │
  │                  │                 │    ┌─────────────┤               │               │
  │                  │                 │    │ alt: SUCCESS│               │               │
  │                  │                 │    ├─────────────┤               │               │
  │                  │                 │  paymentOK       │               │               │
  │                  │                 │◀─────────────────│               │               │
  │                  │                 │  update(order,   │               │               │
  │                  │                 │  status=PAID)    │               │               │
  │                  │                 │──────────────────┼──────────────▶│               │
  │                  │                 │  publish(OrderPaid)              │               │
  │                  │                 │─────────────────────────────────────────────────▶│
  │                  │  201 Created    │                  │               │               │
  │◀─────────────────│◀────────────────│                  │               │               │
  │                  │                 │    ├─────────────┤               │               │
  │                  │                 │    │ alt: FAILURE │               │               │
  │                  │                 │    ├─────────────┤               │               │
  │                  │                 │  paymentFailed   │               │               │
  │                  │                 │◀─────────────────│               │               │
  │                  │                 │  update(order,   │               │               │
  │                  │                 │  status=FAILED)  │               │               │
  │                  │                 │──────────────────┼──────────────▶│               │
  │                  │  400 Payment    │                  │               │               │
  │◀─────────────────│◀── Failed ─────│                  │               │               │
  │                  │                 │    └─────────────┘               │               │
What this reveals:
- The order is saved as PENDING before payment is attempted (so we don't lose orders if payment service is slow)
- On success, an event is published to Kafka (async — notification, analytics, etc. don't block the response)
- On failure, the order status is updated to FAILED and the client gets a 400
- The consistency window: between PENDING save and status update, the order is in a transient state
Interview Questions
Q: When would you use a sequence diagram instead of an architecture diagram in a system design interview? Hint: After drawing the architecture, when you need to show how a specific operation works across components — the order of calls, the error handling, and the timing. Especially for multi-service flows like checkout, auth, or real-time matching.
Q: Draw a sequence diagram for a user logging in with OAuth 2.0 (Google sign-in). Hint: Participants: User, Client App, Auth Server (Google), Resource Server. Flow: User → Client (click login) → redirect to Google → User authenticates → Google redirects with auth code → Client exchanges code for tokens → Client uses access token to call Resource Server.
Q: How do you show eventual consistency in a sequence diagram? Hint: Show the write going to the primary, returning a success to the client, and then separately (with a visible time gap or async arrow) show the replication to the replica. Then show a read hitting the replica and potentially getting stale data. The gap between the write response and replication completing is the consistency window.
Q: What's the difference between a synchronous message and an asynchronous message in a sequence diagram, and how does it affect your design? Hint: Synchronous: solid arrow, the caller blocks waiting for a response. Async: open arrowhead to a queue/event bus, the caller continues immediately. Sync couples the caller to the callee's availability and latency. Async decouples them but introduces eventual consistency and requires idempotent consumers.
Q: Your sequence diagram shows a chain of 5 synchronous calls. What's the problem, and how do you fix it? Hint: Latency compounds — if each call takes 50ms, the total is 250ms+. Availability compounds — if each service is 99.9% available, 5 in series gives ~99.5%. Fix by: making independent calls parallel, converting non-critical calls to async (via queue), or combining services that are always called together.
References
- UML Sequence Diagrams — Visual Paradigm — comprehensive guide to notation
- PlantUML Sequence Diagram Syntax — draw sequence diagrams as code
- UML Distilled by Martin Fowler — Chapter on sequence diagrams with practical advice
Dive Deeper
- Mermaid Sequence Diagram Syntax — draw diagrams in markdown
- Enterprise Integration Patterns by Hohpe & Woolf — messaging patterns that sequence diagrams help visualize
- SequenceDiagram.org — free online tool for quick sequence diagram prototyping