
Disaster Recovery
In a Nutshell
Disaster recovery (DR) is your plan for surviving a large-scale catastrophe — an entire region going dark, a data-center fire, a ransomware attack, or a botched migration that corrupts production. Where fault tolerance handles the routine failure of individual components, DR handles the rare-but-devastating loss of a whole environment. Two numbers define your DR strategy: RTO (Recovery Time Objective — how fast you must be back up) and RPO (Recovery Point Objective — how much data you can afford to lose). Every DR decision is a trade-off between how much you spend on standby infrastructure and how small you can make those two numbers.
How It Actually Works
RTO and RPO: The Two Numbers That Drive Everything
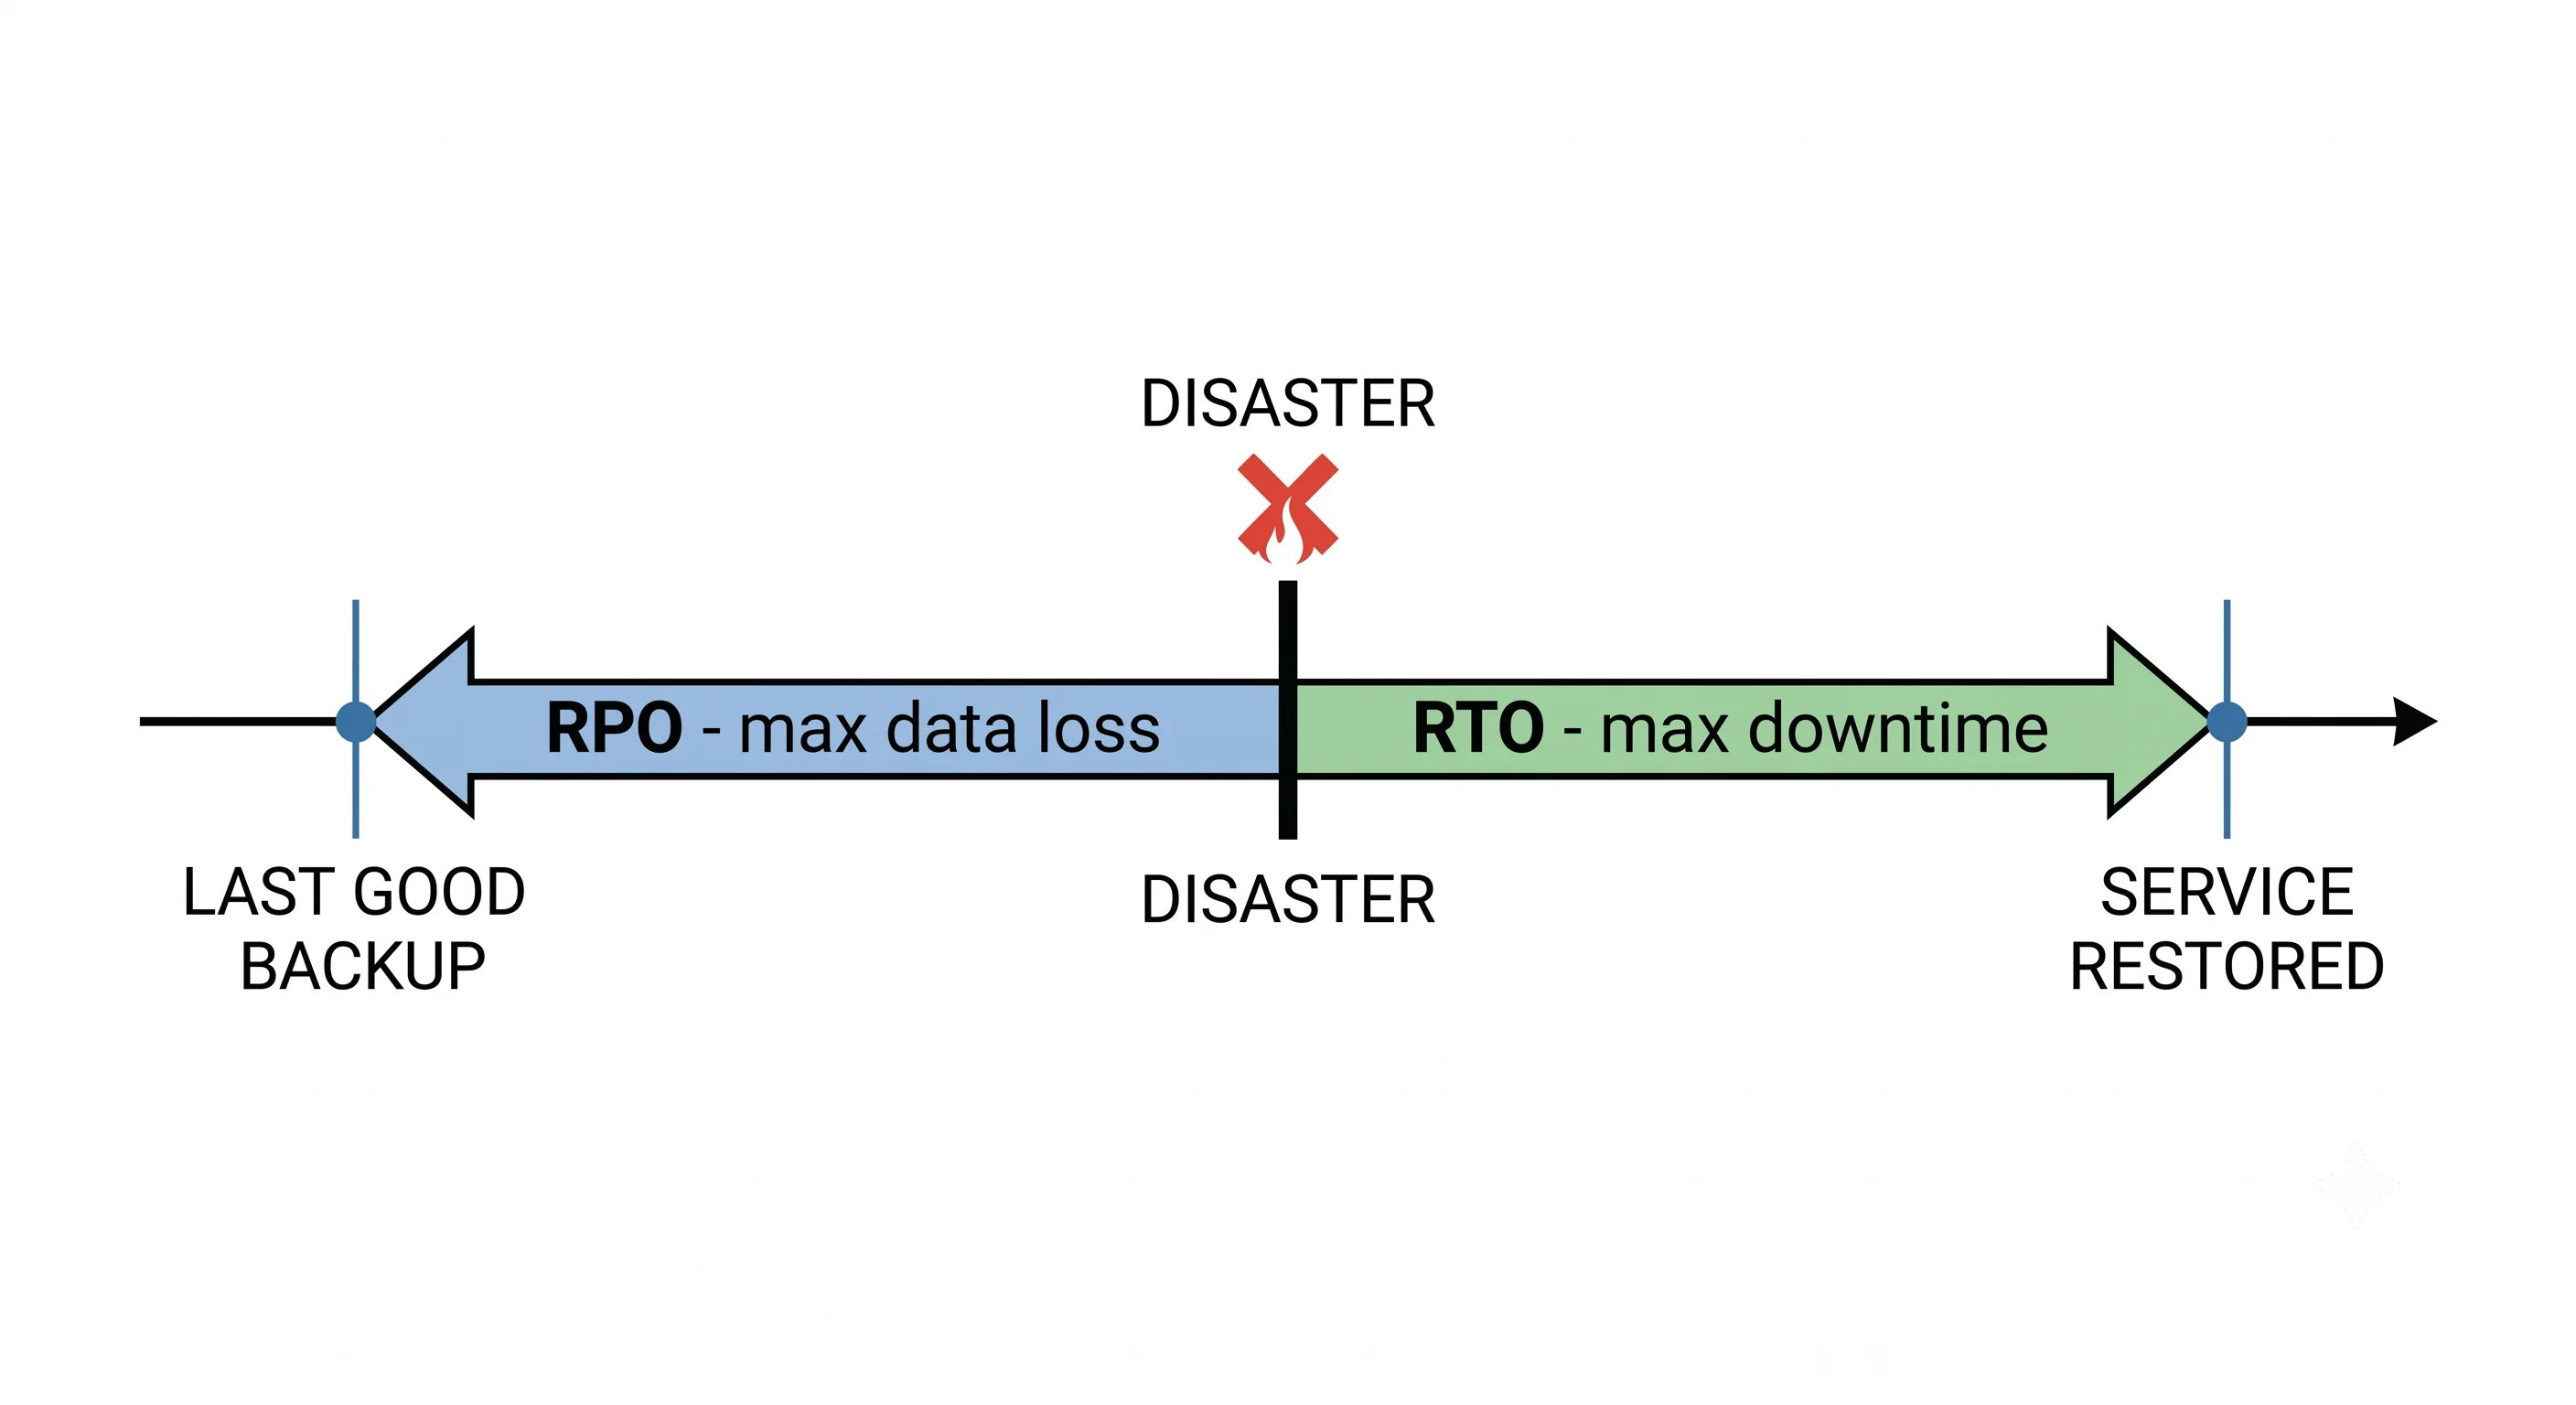
        ◀──── RPO ────▶  disaster  ◀──── RTO ────▶
  ──────●───────────────────╳────────────────────●──────▶ time
     last good              outage            service
     backup/replica         begins            restored

  RPO = how far back your recovery point is = MAX DATA LOSS
RTO = how long until you're serving again = MAX DOWNTIME| Metric | Question It Answers | Driven By |
|---|---|---|
| RPO | How much data can we lose? | Backup/replication frequency |
| RTO | How long can we be down? | Standby readiness + automation |
A payments system might demand RPO ≈ 0 (no lost transactions) and RTO of minutes. A marketing blog might accept RPO of 24 hours and RTO of a day. The tighter the numbers, the more you pay.
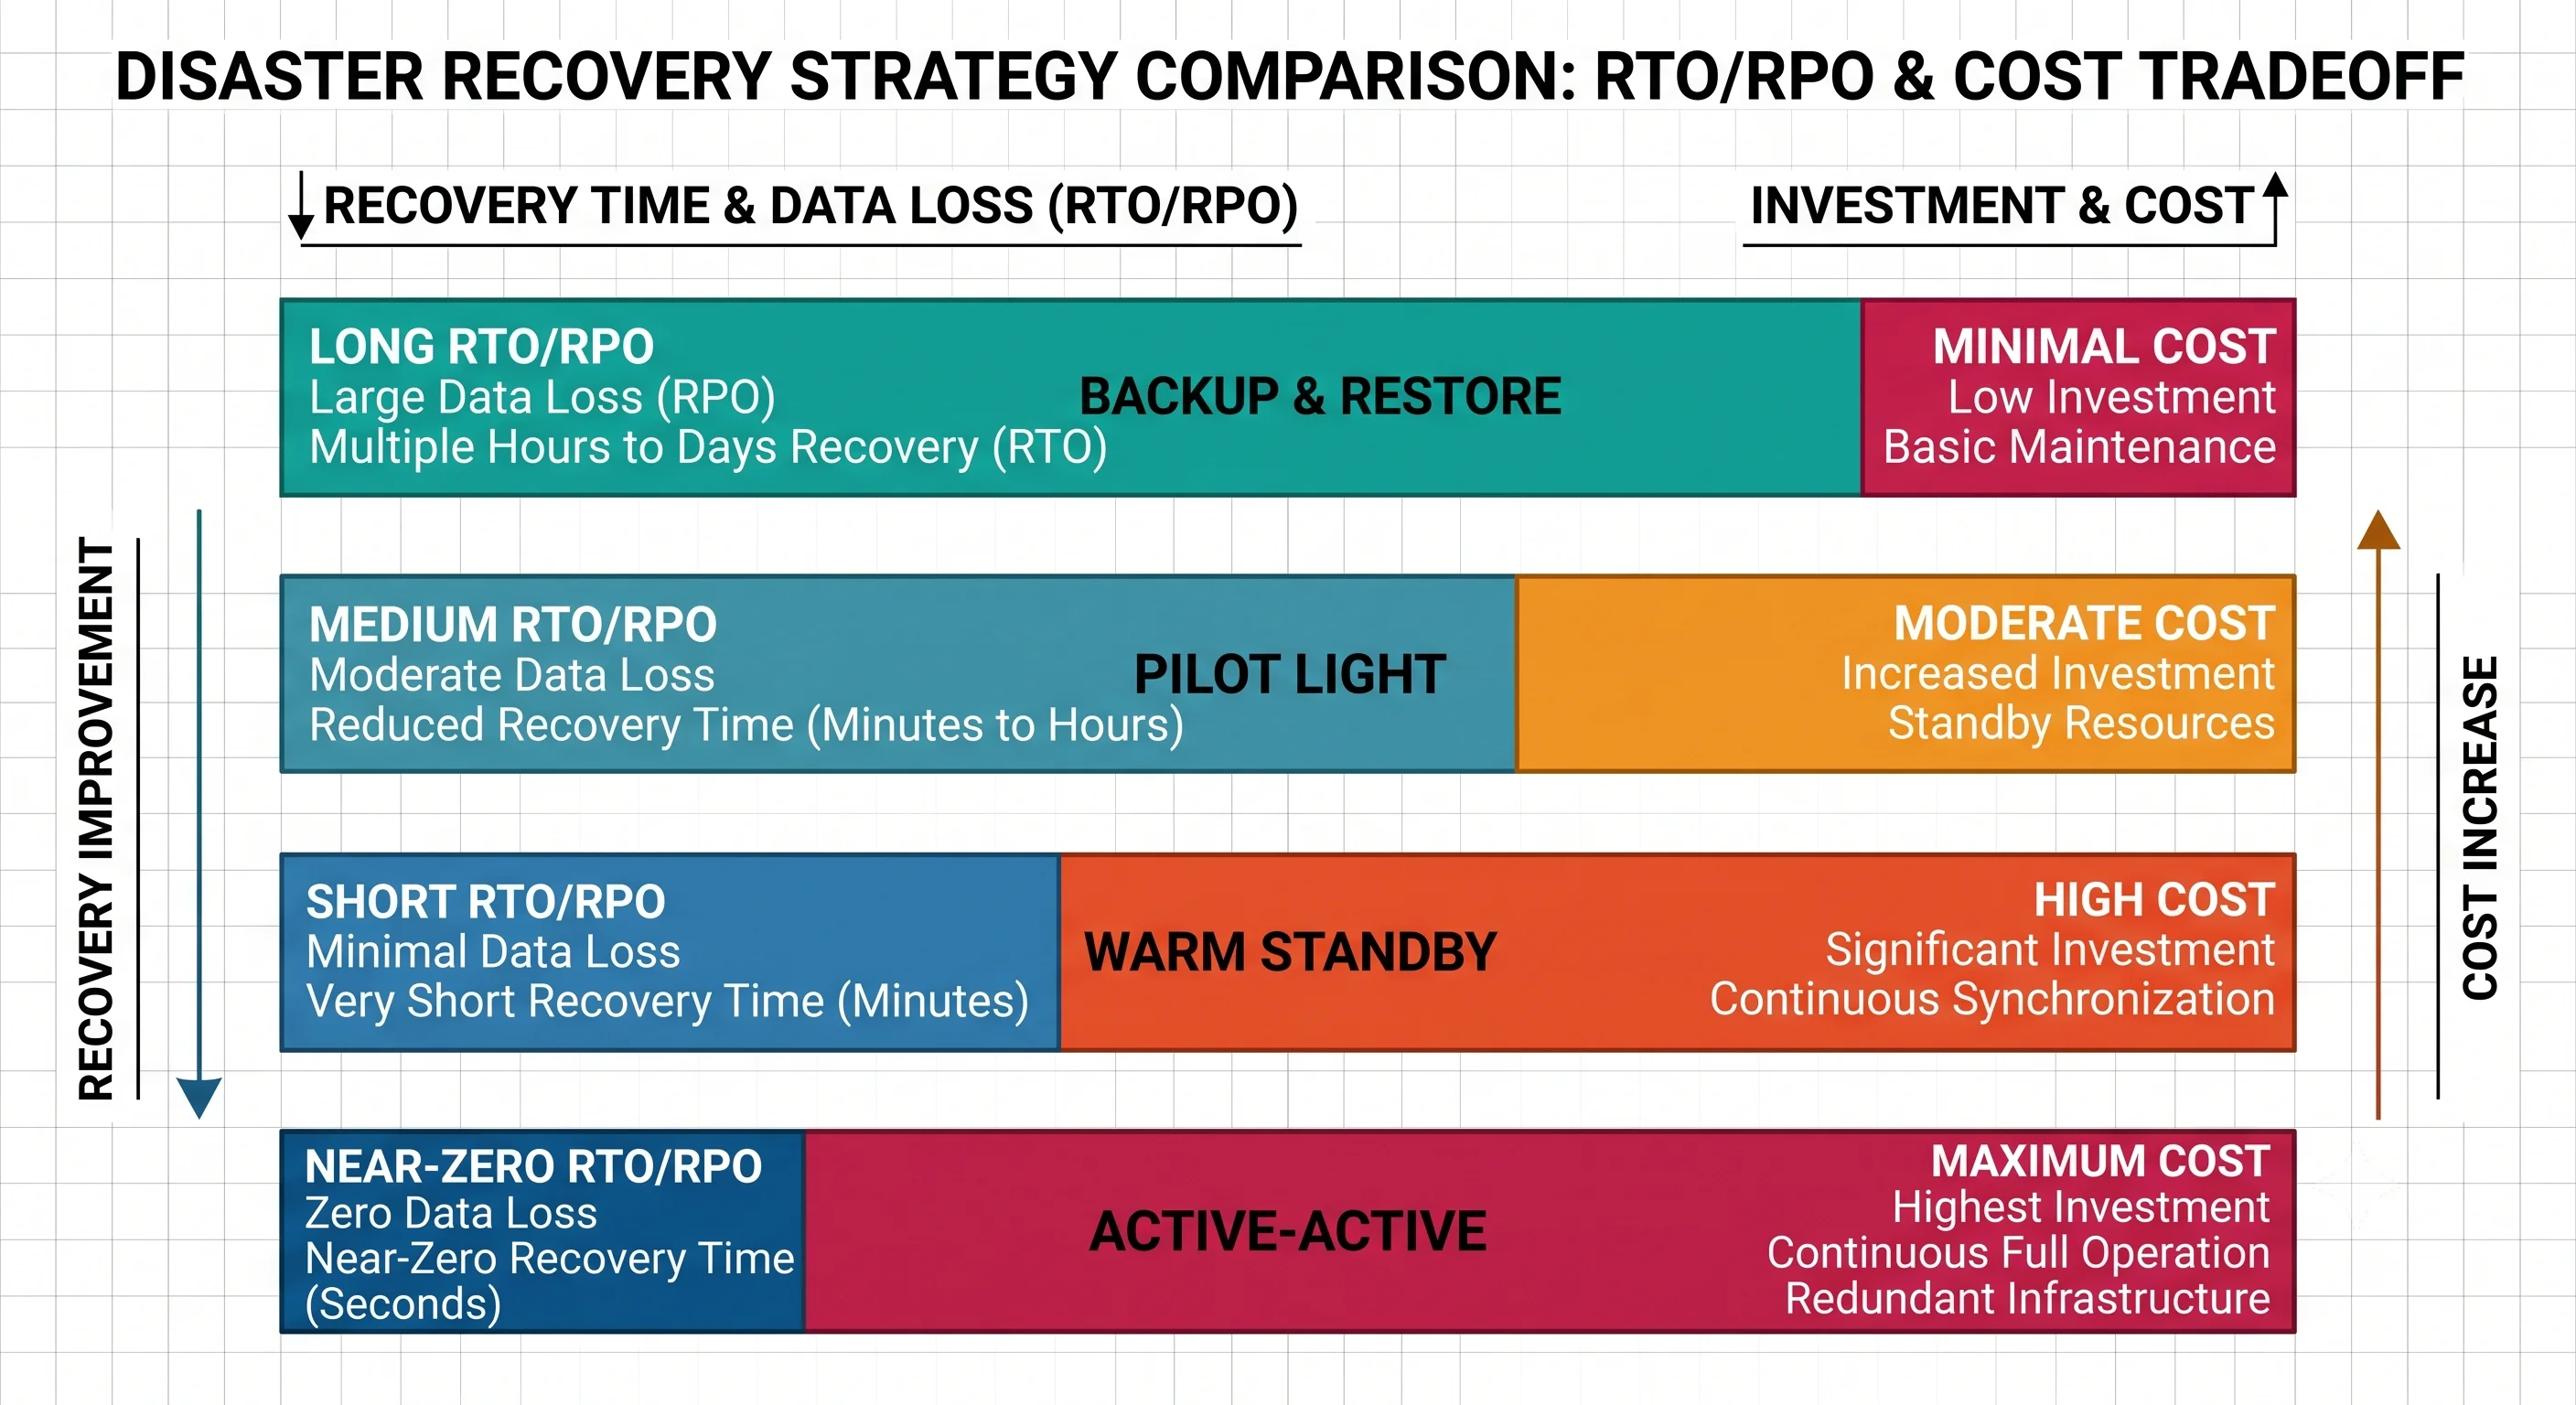
The Four DR Strategies (Cheapest → Most Expensive)
| Strategy | How It Works | RTO | RPO | Cost |
|---|---|---|---|---|
| Backup & Restore | Restore from backups into new infra | Hours–days | Hours | $ |
| Pilot Light | Minimal core (DB replica) always on; scale up on disaster | 10s of min | Minutes | $$ |
| Warm Standby | Scaled-down but running copy in another region | Minutes | Seconds | $$$ |
| Multi-Site Active-Active | Full stack live in multiple regions | Near-zero | Near-zero | $$$$ |
Backup & Restore   ──▶  Pilot Light  ──▶  Warm Standby  ──▶  Active-Active
     cheapest                                                   priciest
    slowest RTO                                              near-zero RTO
Backup & Restore
Regular backups stored in a different location (ideally a different region/provider). Simple and cheap, but restoring a large dataset takes time — and an untested restore is worthless.
Pilot Light
Keep the minimum critical core always running in the DR region — typically a continuously-replicated database and baseline config — while everything else is dormant. On disaster, you "turn up the flame": launch app servers, scale out, and cut traffic over. Cheaper than a full standby because you're only paying to keep the data warm.
Warm Standby
A fully functional but under-scaled copy of the whole stack runs in a second region. It can take real traffic immediately, then autoscale to full capacity. Faster RTO than pilot light, higher cost.
Multi-Site Active-Active
The full application runs live in two or more regions simultaneously, all serving traffic. A regional loss just means the other region absorbs the load. Near-zero RTO/RPO but the most expensive and complex (requires cross-region data consistency — see Data Consistency).
The Rules That Make DR Actually Work
- 3-2-1 backup rule: 3 copies of data, on 2 different media types, with 1 offsite. Modern variant adds "1 immutable/offline" copy to survive ransomware.
- Geographic isolation: the DR site must not share fate with production — different region, ideally different provider for the highest tiers.
- Test your DR, regularly: an untested plan is a hope, not a plan. Run DR drills / game days; measure actual RTO/RPO against targets.
- Automate the runbook: manual DR under stress at 3am is error-prone. Script the failover.
Seeing It in Action
Scenario: Choosing a DR strategy for an e-commerce platform.
Requirements:
  - Checkout/orders: cannot lose transactions → RPO ≈ 0, RTO ≤ 5 min
  - Product catalog:  can rebuild from source → RPO 1h, RTO 1h OK
  - Analytics events: nice-to-have → RPO 24h, RTO 24h OK

Tiered DR (spend where it matters):
  ┌──────────────────────────────────────────────────────────┐
  │ Orders DB       → Active-Active w/ synchronous cross-region │  $$$$
  │                   replication (RPO≈0). Pays for itself in   │
  │                   one avoided lost-order incident.          │
  ├──────────────────────────────────────────────────────────┤
  │ Catalog         → Warm standby, async-replicated (RPO secs)│  $$$
  ├──────────────────────────────────────────────────────────┤
  │ Analytics       → Backup & restore, nightly to S3 in       │  $
  │                   another region. Cheap, slow, acceptable.  │
  └──────────────────────────────────────────────────────────┘

DR drill (quarterly):
  - Simulate region loss; fail orders traffic to region B
  - Measure actual RTO/RPO; fix gaps found (e.g., stale DNS TTLs)
Key insight: DR isn't one-size-fits-all. Tier your data by business criticality and spend on tight RTO/RPO only where the cost of loss justifies it — running everything active-active would be wasteful.
Interview Questions
Q: Define RTO and RPO and explain how they shape a DR strategy. Hint: RTO = maximum acceptable downtime (drives standby readiness/automation). RPO = maximum acceptable data loss (drives backup/replication frequency). Tighter numbers require more expensive strategies — near-zero RPO needs synchronous replication; near-zero RTO needs a live standby. You pick a DR strategy that meets the required numbers at the lowest cost.
Q: Compare backup-and-restore, pilot light, warm standby, and active-active. Hint: Increasing cost and decreasing RTO/RPO: Backup & Restore (restore into new infra, hours, cheapest) → Pilot Light (core/DB always warm, scale up on disaster) → Warm Standby (full but under-scaled stack running) → Active-Active (full stack live in multiple regions, near-zero RTO/RPO, priciest and most complex).
Q: What's the difference between fault tolerance / HA and disaster recovery? Hint: HA/fault tolerance handle routine, component-level failures within an environment (a server or AZ) to keep serving continuously. DR handles rare, large-scale catastrophes that take out a whole region/environment (natural disaster, ransomware, regional outage) and is about recovering the entire system, often in another location.
Q: What is the 3-2-1 backup rule and why does the "offsite/immutable" part matter? Hint: 3 copies of data, on 2 media types, with 1 offsite. The offsite copy survives a site-wide disaster; an immutable/offline copy survives ransomware that encrypts or deletes online backups. Backups that live only in the same environment as production share its fate and don't protect against regional loss or malicious deletion.
Q: Why do teams that "have backups" still fail to recover from disasters? Hint: Untested restores. Backups may be corrupt, incomplete, missing dependencies (schema, secrets, config), or too slow to meet RTO. DR requires regular drills that actually restore and measure RTO/RPO, automated runbooks (manual recovery under stress fails), and geographic/provider isolation so the DR site doesn't share the disaster.
References
- AWS Disaster Recovery whitepaper — the four strategies in depth
- Google SRE Book — Data Integrity — backups, RTO/RPO, and why restores fail
- The 3-2-1 Backup Rule (US-CERT/CISA) — canonical backup guidance
Dive Deeper
- GitLab's database incident postmortem (2017) — a famous case of backups that didn't work
- Netflix Chaos Kong — regularly failing out entire regions in production
- Site Reliability Engineering by Google — the operational discipline behind real DR