
Auto-Scaling & Elasticity
In a Nutshell
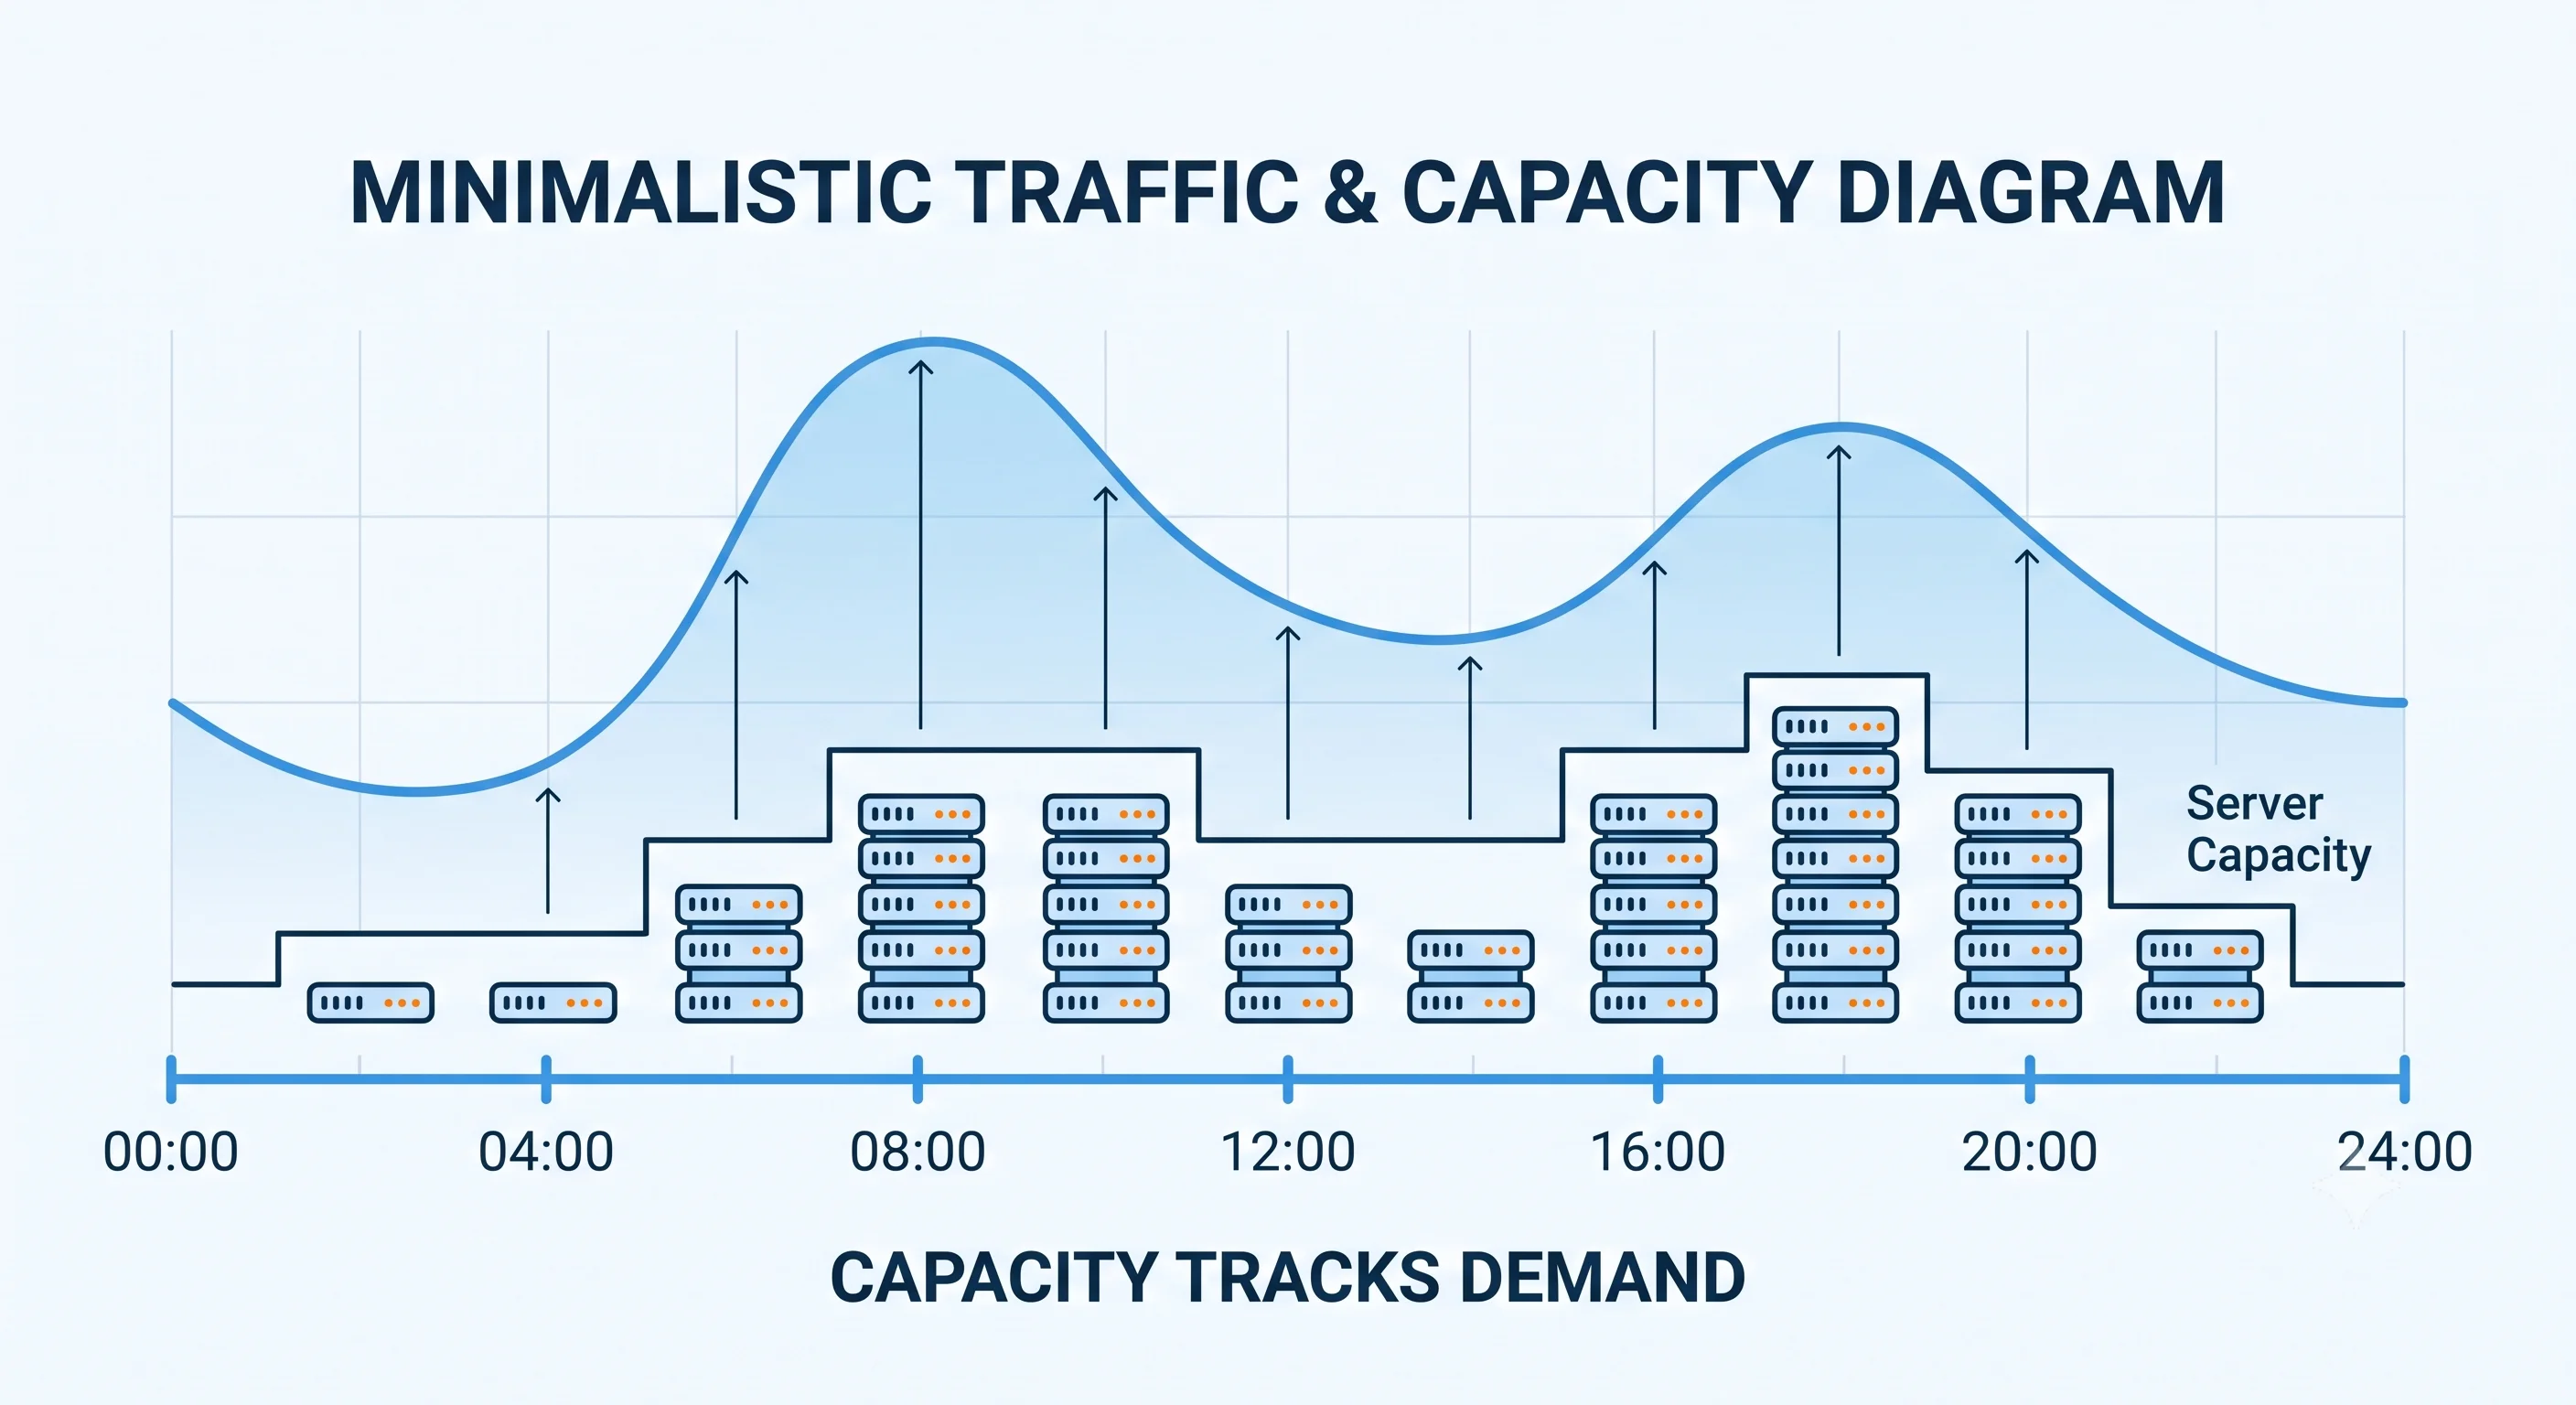
Elasticity is a system's ability to automatically grow when demand rises and shrink when it falls — so you pay for what you need and nothing more. Auto-scaling is the mechanism that delivers it: a controller watches metrics (CPU, request rate, queue depth) and adds or removes instances to match load. Done well, it absorbs traffic spikes without human intervention and cuts costs during quiet hours. Done poorly, it thrashes (constantly adding and removing nodes), reacts too slowly to catch spikes, or scales the wrong tier. The art is in choosing the right signal, tuning thresholds, and respecting warm-up and cool-down periods.
How It Actually Works
The Control Loop
Auto-scaling is a feedback loop: observe → decide → act → wait.
   ┌─────────────┐
   │  Metrics    │  CPU, req/s, queue depth, p99 latency
   │  Collector  │
   └──────┬──────┘
          │ observe
   ┌──────▼──────┐
   │  Scaling    │  compare metric to target/threshold
   │  Policy     │  decide: scale out? in? hold?
   └──────┬──────┘
          │ act
   ┌──────▼──────┐
   │  Provisioner │ launch/terminate instances,
   │  (ASG/HPA)   │ register/deregister from LB
   └──────┬──────┘
          │ wait (cool-down / stabilization)
          └────────► back to observe
Types of Auto-Scaling
| Type | How It Decides | Best For |
|---|---|---|
| Reactive (metric-based) | Threshold on live metrics (e.g., CPU > 70%) | General-purpose; unpredictable load |
| Scheduled | Time-based rules (scale up at 8am, down at 8pm) | Predictable daily/weekly patterns |
| Predictive | ML forecasts future load from history | Recurring but spiky patterns (retail, media) |
| Target-tracking | Keeps a metric at a target value (like a thermostat) | Simplest to reason about; the modern default |
Horizontal vs Vertical Auto-Scaling
- Horizontal (add/remove instances) — the common case. In Kubernetes this is the Horizontal Pod Autoscaler (HPA); in AWS it's an Auto Scaling Group (ASG).
- Vertical (resize instances) — grow/shrink CPU and memory of existing nodes (K8s VPA). Usually needs a restart, so it's less seamless.
- Cluster/node autoscaling — when pods can't be placed, add worker nodes to the cluster (K8s Cluster Autoscaler, Karpenter).
Choosing the Right Signal
CPU is the default but often the wrong signal. Better signals depend on the bottleneck:
| Workload | Better Scaling Signal |
|---|---|
| CPU-bound API | CPU utilization |
| I/O-bound / latency-sensitive | p95/p99 latency, in-flight requests |
| Queue consumers | Queue depth / message backlog per consumer |
| Web frontends | Requests per second per instance |
Scaling a queue-worker fleet on CPU is a classic mistake — workers can be idle-waiting on I/O with low CPU while the backlog explodes. Scale on backlog per worker instead.
The Four Timing Parameters That Make or Break It
| Parameter | What It Controls | Failure If Wrong |
|---|---|---|
| Warm-up time | How long a new instance takes to be useful (boot + app start + cache warm) | Traffic hits cold instances → errors |
| Cool-down / stabilization | Minimum wait between scaling actions | Thrashing (rapid add/remove cycles) |
| Scale-out step | How many instances to add per action | Too small = slow to catch spikes |
| Scale-in policy | How aggressively to remove | Too aggressive = removing capacity you still need |
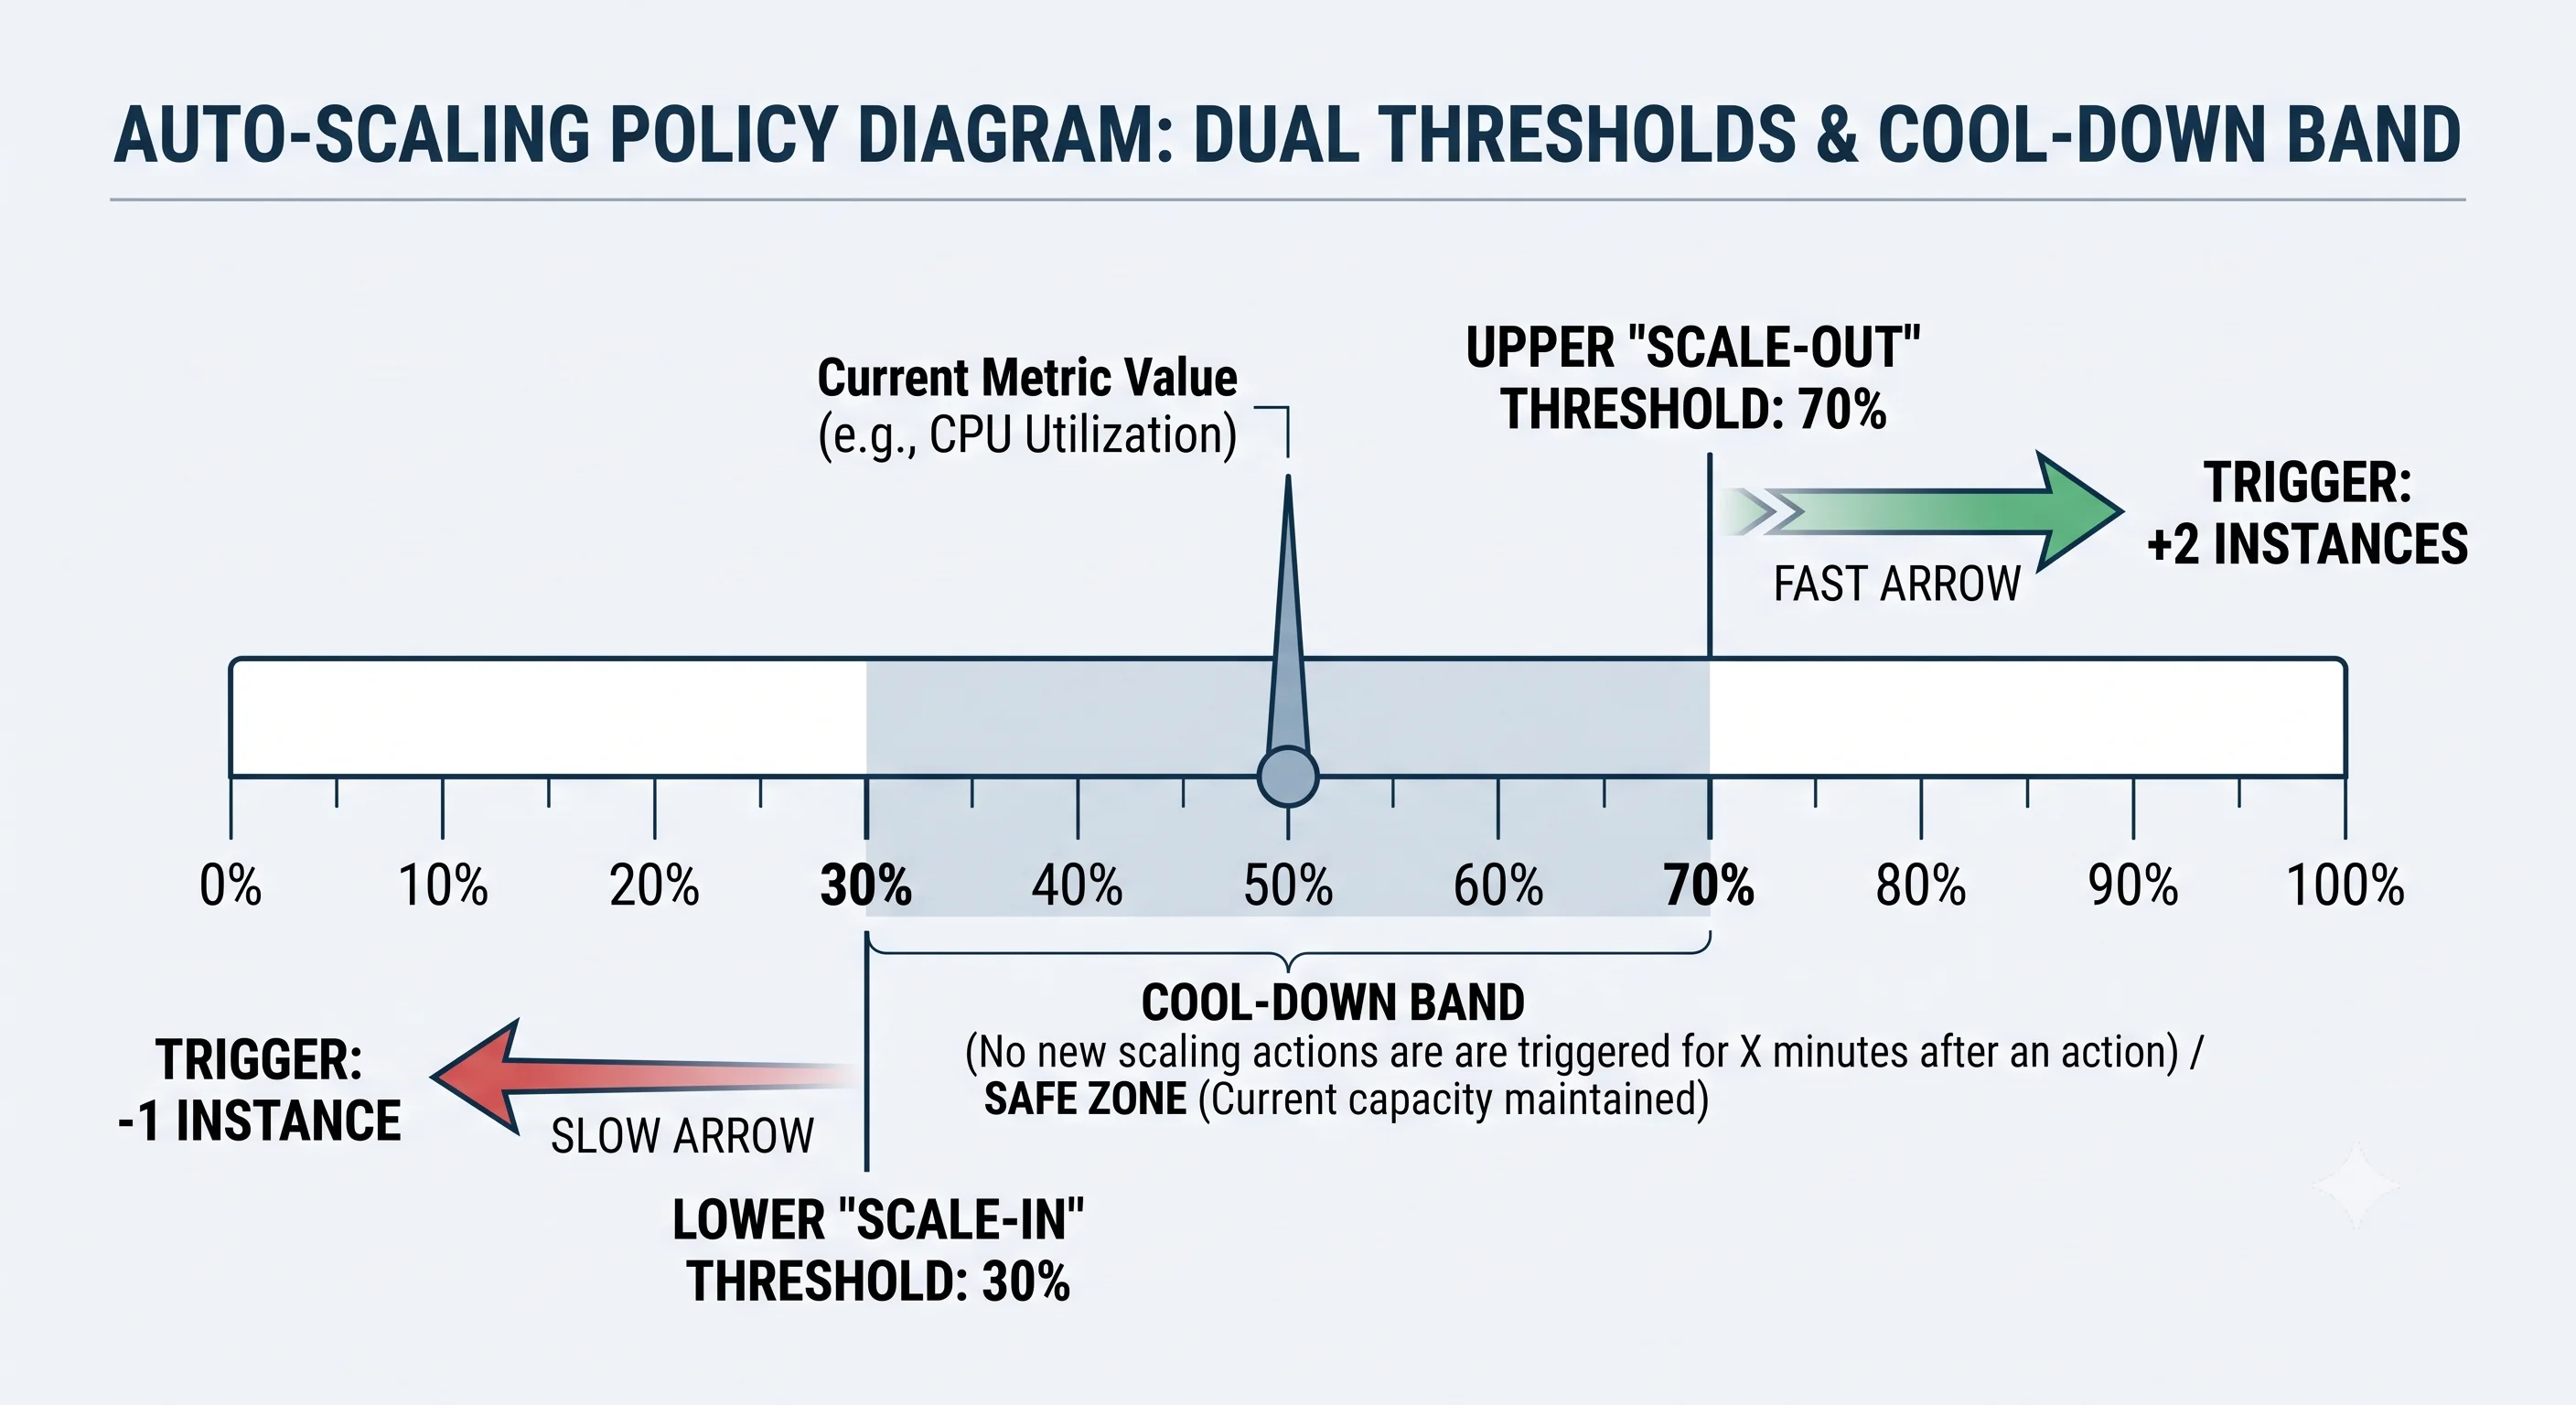
Asymmetry rule: scale out fast, in slow. The cost of being under-provisioned (dropped requests, SLA breach) is far higher than briefly running a few extra instances.
Seeing It in Action
Scenario: Kubernetes HPA for a checkout service.
apiVersion: autoscaling/v2
kind: HorizontalPodAutoscaler
metadata:
  name: checkout-hpa
spec:
  scaleTargetRef:
    apiVersion: apps/v1
    kind: Deployment
    name: checkout
  minReplicas: 3          # never below 3 (availability floor)
  maxReplicas: 40         # cost ceiling
  metrics:
  - type: Resource
    resource:
      name: cpu
      target:
        type: Utilization
        averageUtilization: 65   # target-tracking on CPU
  behavior:
    scaleUp:
      stabilizationWindowSeconds: 0     # react to spikes immediately
      policies:
      - type: Percent
        value: 100                      # can double pods per step
        periodSeconds: 30
    scaleDown:
      stabilizationWindowSeconds: 300   # wait 5 min before shrinking
      policies:
      - type: Pods
        value: 1                        # remove gently
        periodSeconds: 60
What this encodes: a hard floor of 3 pods for availability, immediate aggressive scale-out (double every 30s if needed), and cautious scale-in (one pod per minute after a 5-minute calm period). This asymmetry prevents thrashing while still catching flash sales.
Cost angle: pair this with spot/preemptible instances for the burst capacity above your baseline, keeping the steady-state 3 pods on on-demand for reliability.
Interview Questions
Q: What's the difference between elasticity and scalability? Hint: Scalability is the capacity to handle more load by adding resources. Elasticity is the automatic, dynamic matching of resources to current demand in both directions (out and in). A system can be scalable (you can add capacity) without being elastic (it doesn't do so automatically). Elasticity implies scalability plus automation.
Q: Why is CPU often a poor auto-scaling signal, and what's better? Hint: CPU misrepresents I/O-bound and queue-based workloads — a worker can have low CPU while its backlog explodes. Better signals: request latency (p95/p99), requests-per-instance for web tiers, and queue depth / backlog-per-consumer for async workers. Scale on the metric that actually reflects your bottleneck.
Q: Your autoscaler is "thrashing" — rapidly adding and removing instances. How do you fix it? Hint: Add/increase cool-down (stabilization) windows, make scale-in slower and less aggressive than scale-out, widen the gap between scale-out and scale-in thresholds (hysteresis), and use averaged metrics over a window rather than instantaneous spikes.
Q: Why should scale-out and scale-in be asymmetric? Hint: Under-provisioning causes dropped requests and SLA violations (expensive/customer-facing); over-provisioning briefly just costs a little extra compute (cheap). So scale out fast and aggressively, scale in slowly and conservatively.
Q: Auto-scaling added instances but users still saw errors during a spike. Why? Hint: Warm-up lag — new instances take time to boot, start the app, and warm caches/JIT before they can serve traffic. If the spike outpaces provisioning, requests hit cold or nonexistent capacity. Fixes: predictive/scheduled pre-scaling, keeping a warm buffer, faster boot (lighter images, pre-baked AMIs), and connection draining / readiness gates so traffic only routes to ready instances.
References
- AWS Auto Scaling documentation — ASGs, target tracking, predictive scaling
- Kubernetes Horizontal Pod Autoscaler — the HPA algorithm and behavior tuning
- Designing Data-Intensive Applications by Martin Kleppmann — elasticity in Chapter 1
Dive Deeper
- Karpenter — fast, flexible node autoscaling for Kubernetes
- Netflix: Scryer — Predictive Auto Scaling — forecasting-based scaling at scale
- Google SRE Book — Autoscaling — reliability-focused view of when autoscaling helps and hurts