
Architecture Diagram
In a Nutshell
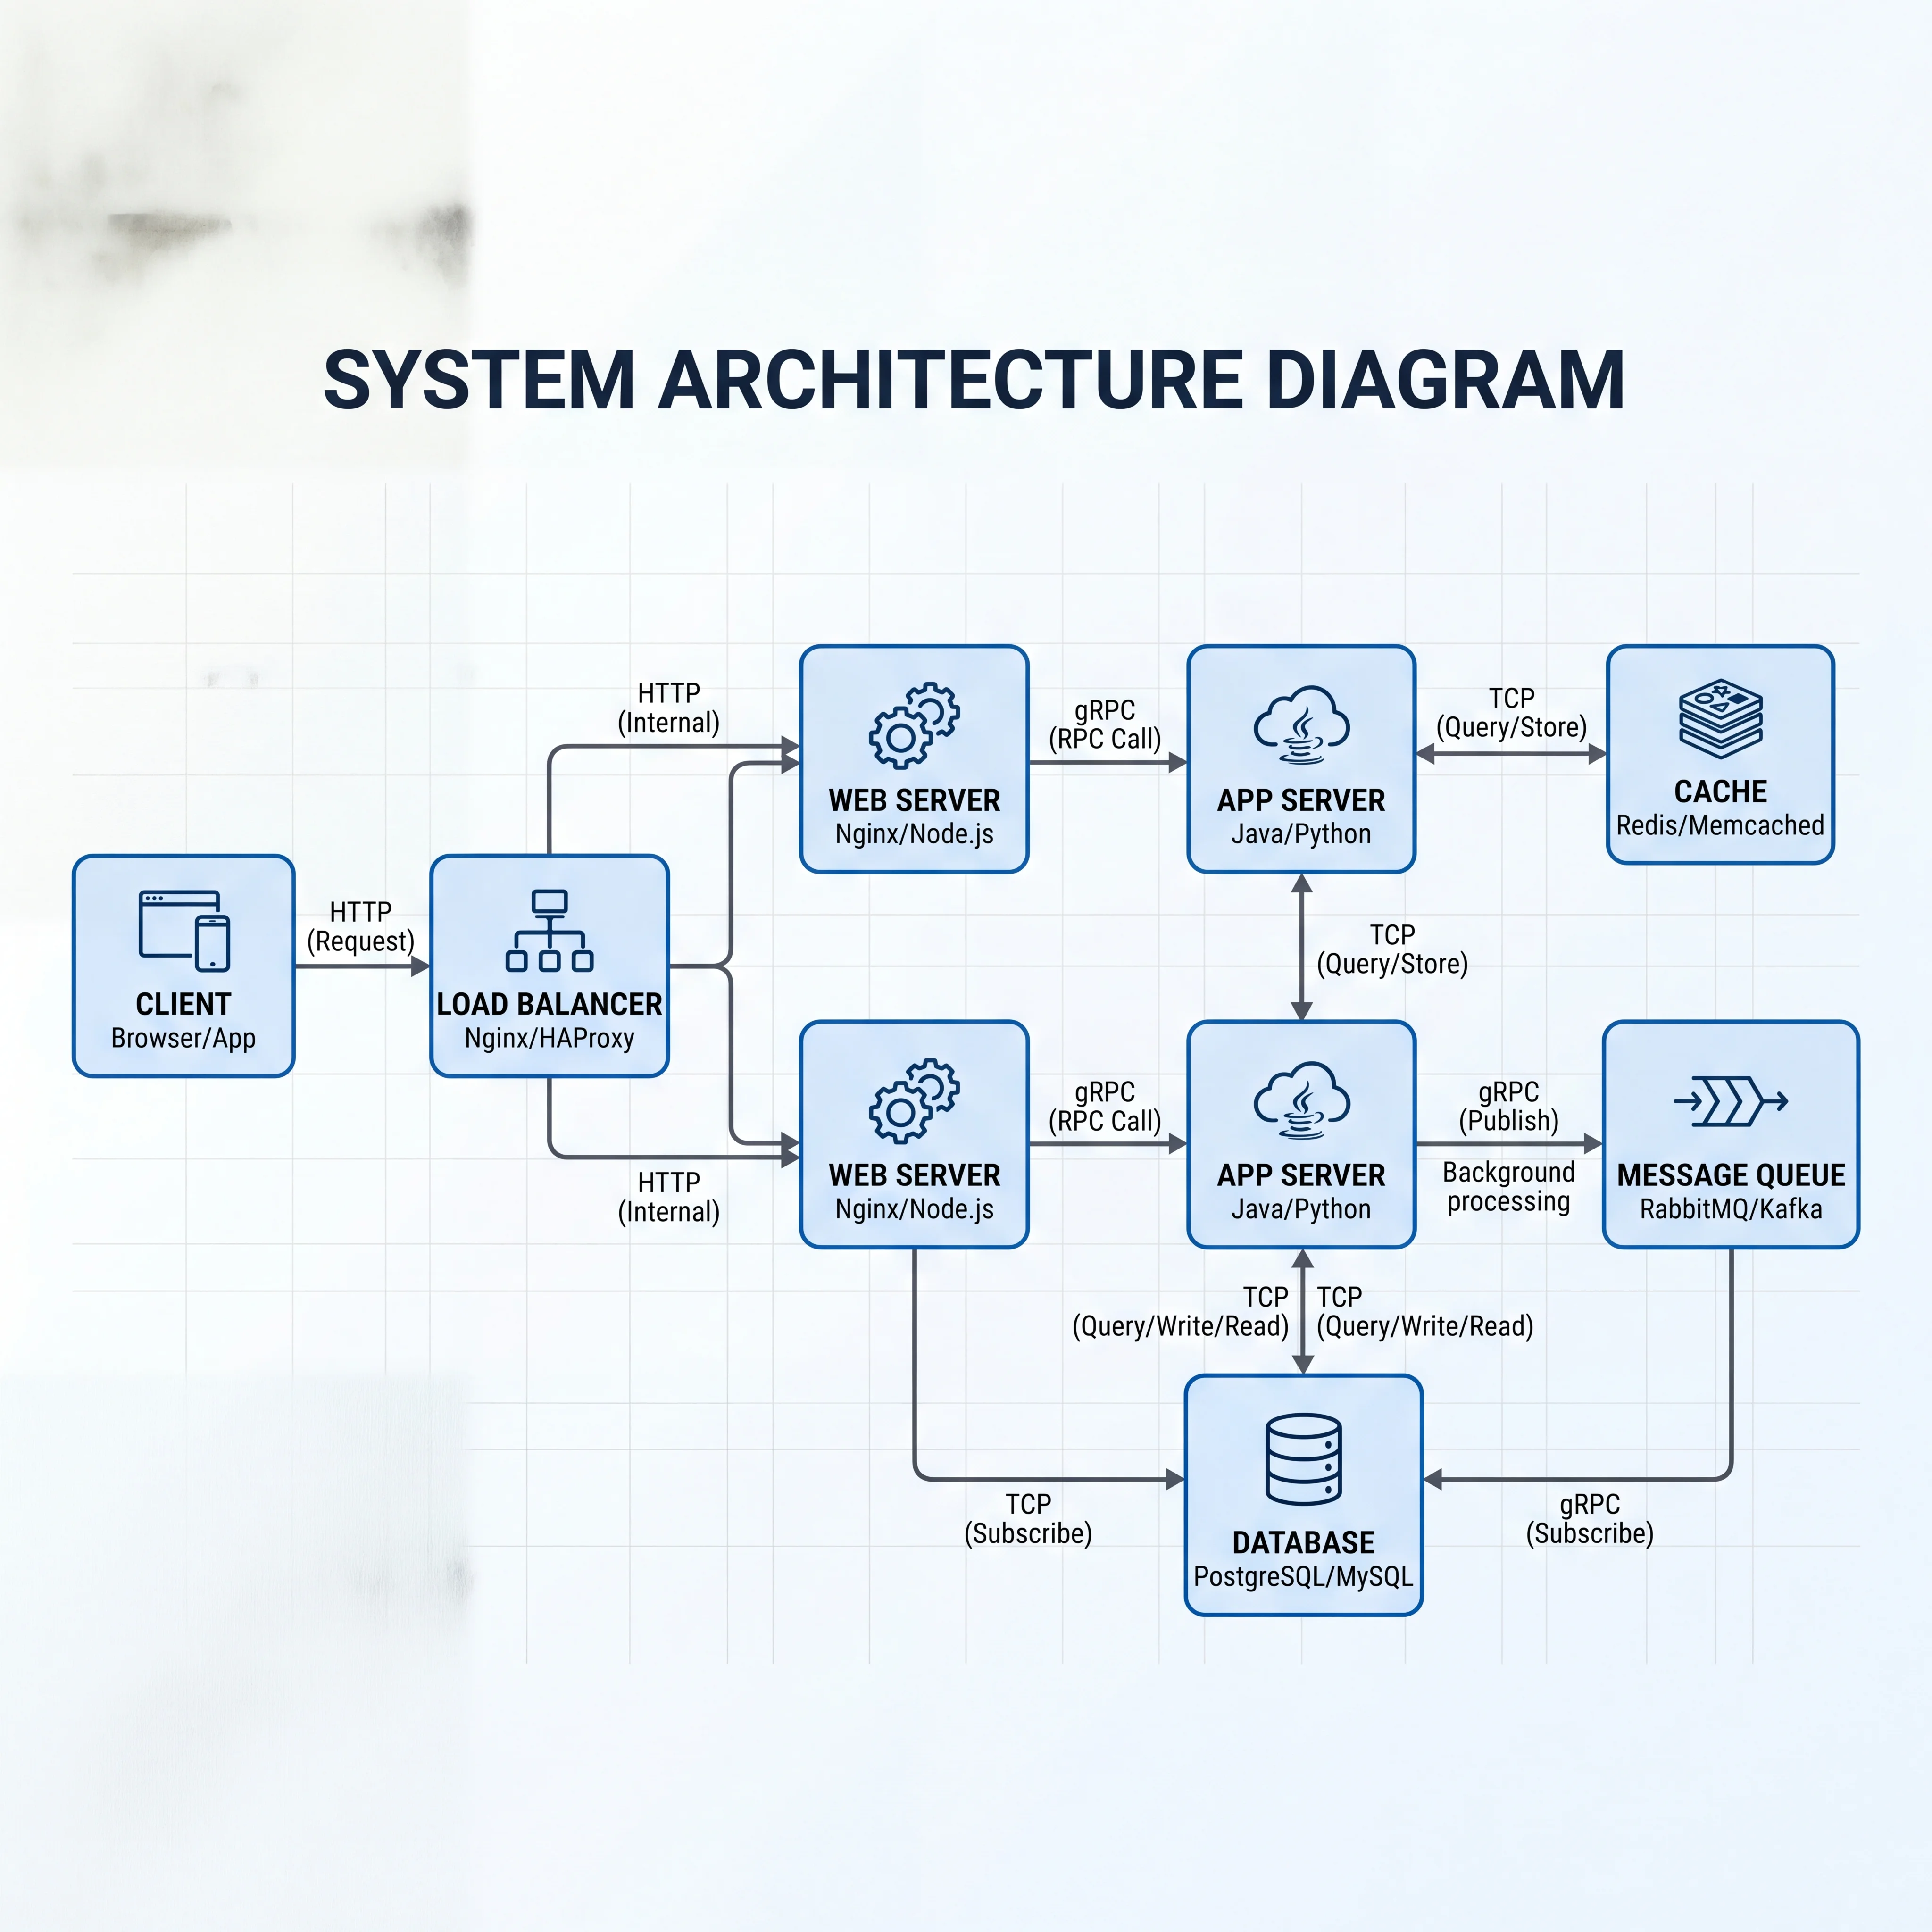
An architecture diagram is the most fundamental visual in system design. It shows the components of your system (services, databases, caches, queues, external systems) and the connections between them (protocols, data flow direction). Think of it as the map of your system — it tells you what exists, where it lives, and how the pieces talk to each other. If you produce only one diagram in a design, this is the one.
How It Actually Works
What an Architecture Diagram Contains
| Element | Representation | Example |
|---|---|---|
| Components | Boxes or shapes | Web server, API service, Redis cache, PostgreSQL |
| Connections | Arrows (solid for sync, dashed for async) | HTTP request, gRPC call, Kafka message |
| Boundaries | Dashed rectangles or shaded regions | VPC, availability zone, microservice boundary |
| External systems | Boxes outside the boundary | Third-party payment gateway, email provider |
| Labels | Text on arrows and boxes | Protocol, port, data type, direction |
| Data stores | Cylinder shapes (convention) | Databases, caches, object storage |
Types of Architecture Diagrams
Logical architecture — shows components and their relationships without specifying infrastructure. "We have a User Service that talks to a User Database." Best for design discussions.
Physical/deployment architecture — shows where components run: which cloud, which region, which instance type. "The User Service runs on 3 x m5.large in us-east-1a, behind an ALB." Best for ops reviews.
Integration architecture — focuses on how your system connects to external systems: APIs, webhooks, file transfers, shared databases. Best for cross-team communication.
How to Draw One Well
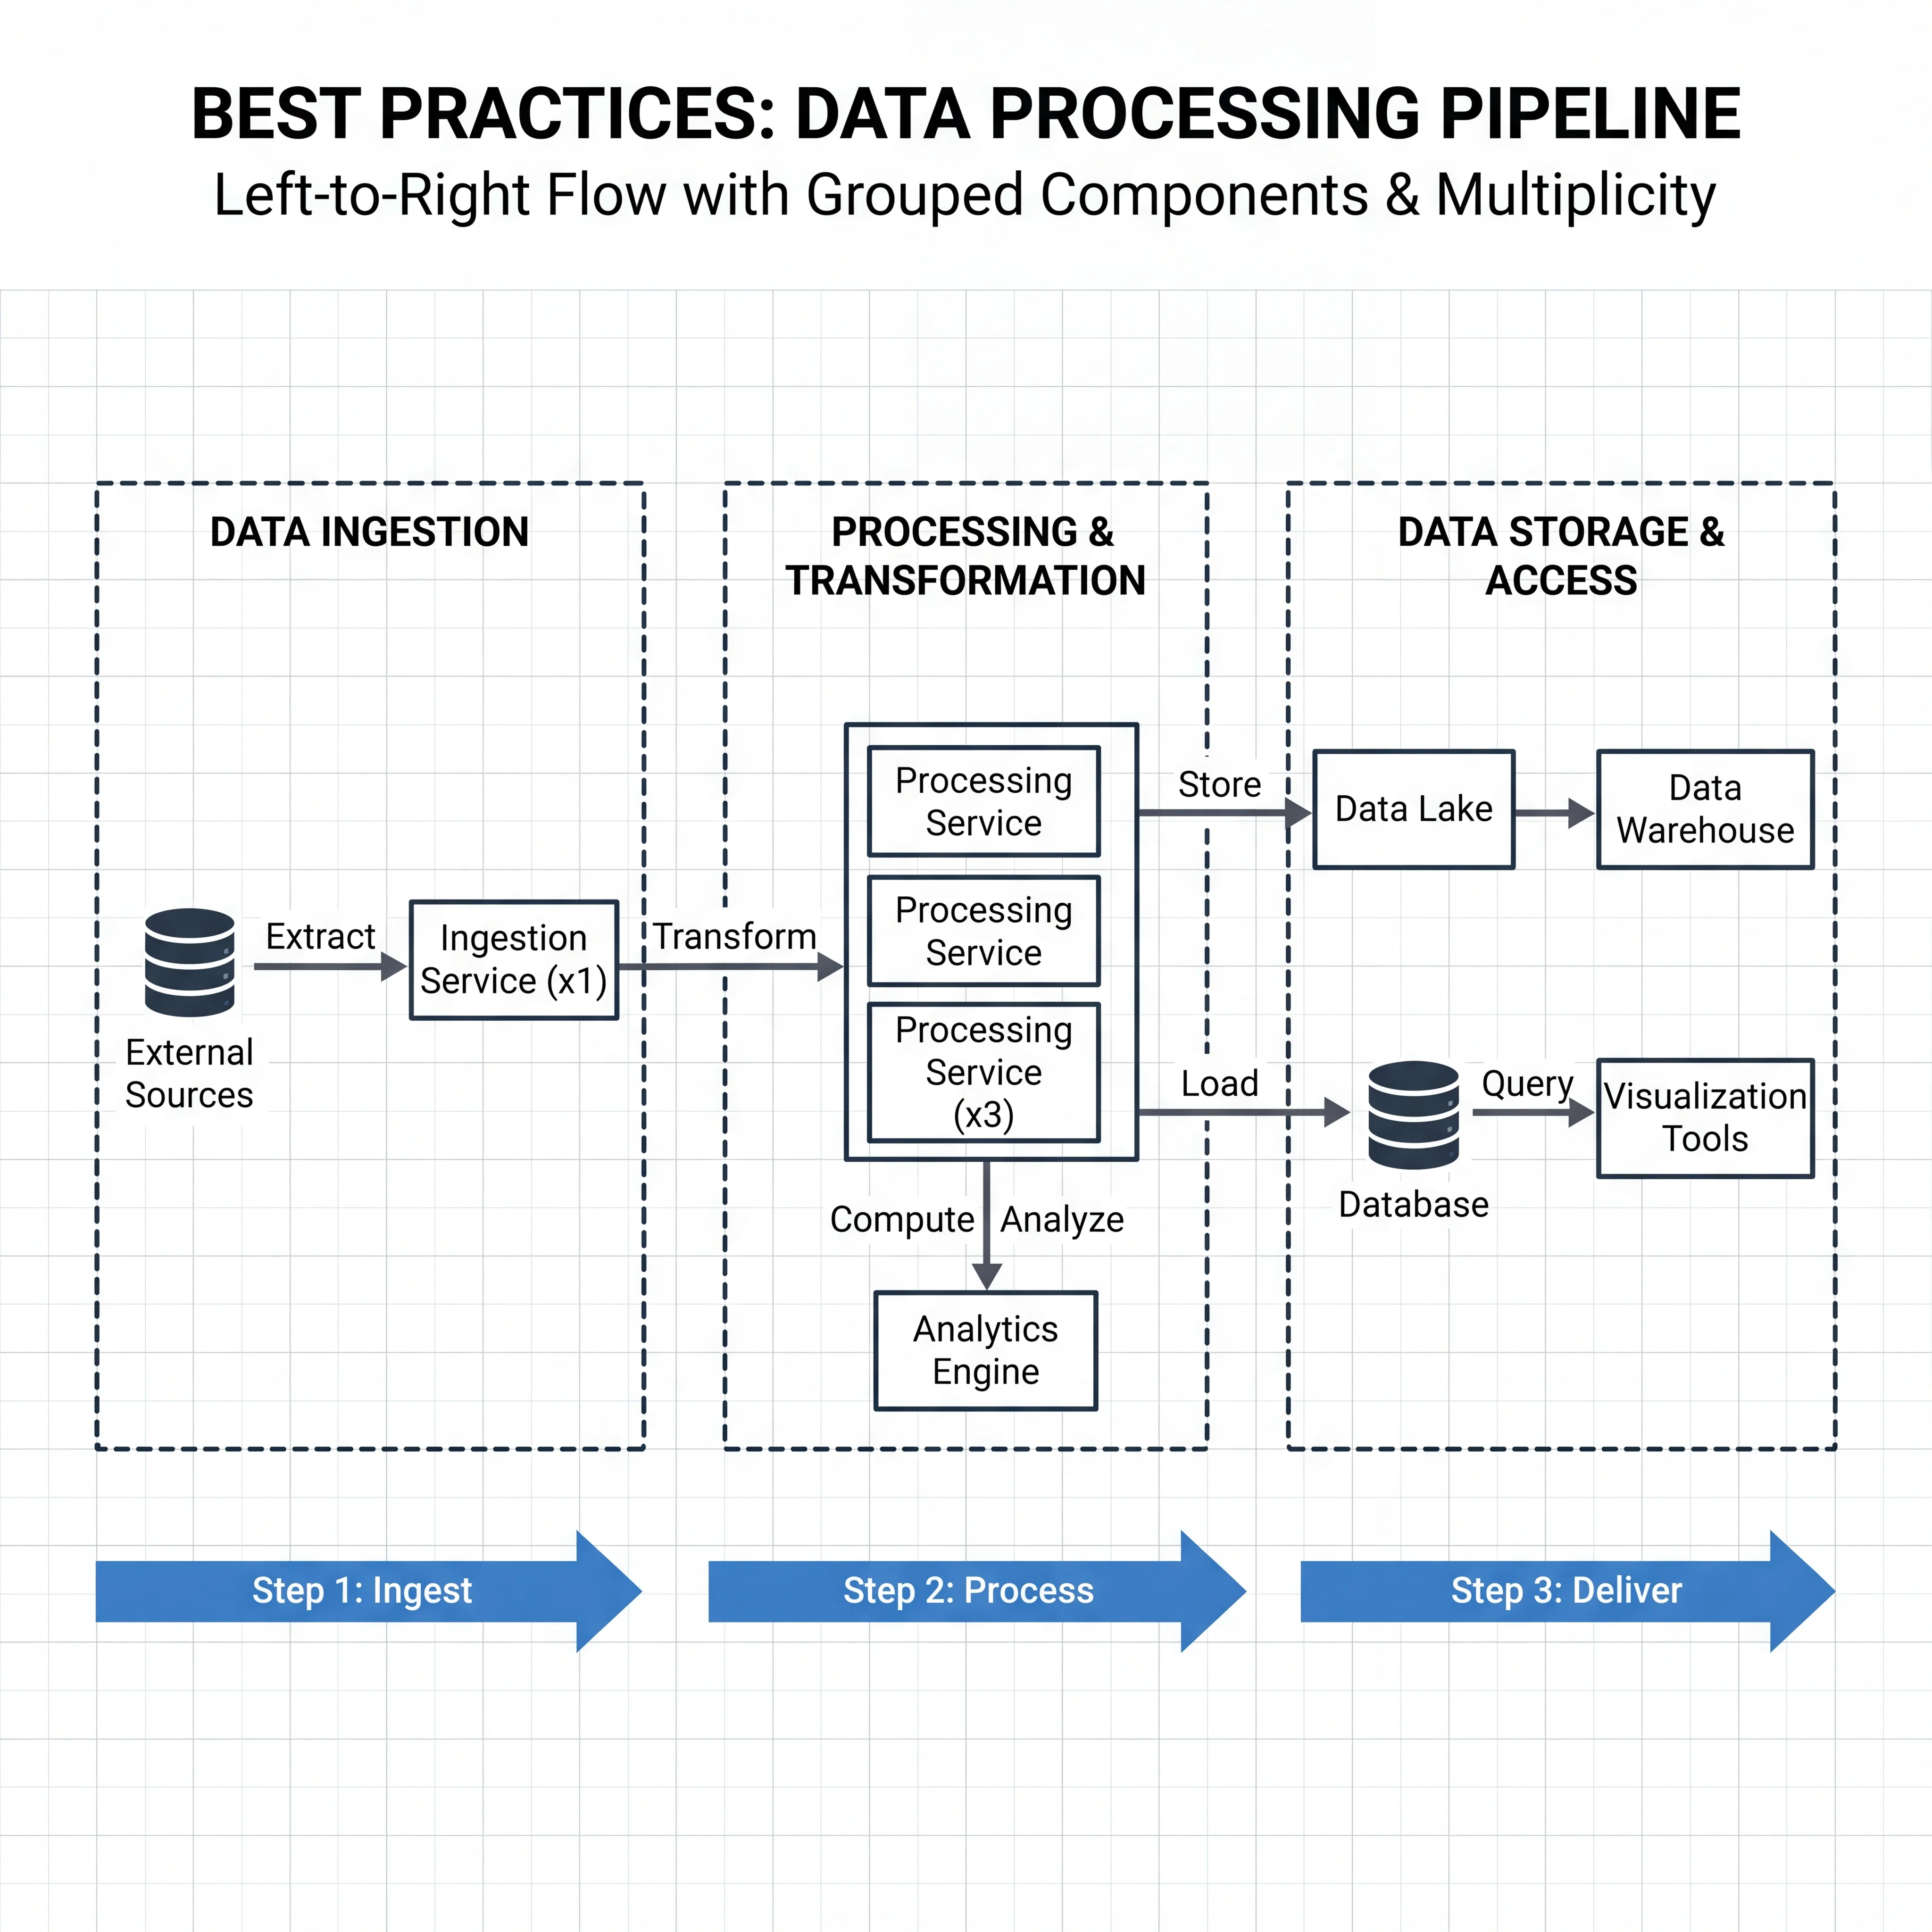
- Left-to-right flow — Put clients on the left, infrastructure on the right. Data flows from left to right.
- Group related components — Draw boxes around services that belong to the same domain (e.g., "Order Domain" containing Order Service, Order DB, Order Cache).
- Label every arrow — An unlabeled arrow is an assumption nobody examined. Include protocol (HTTP, gRPC, WebSocket) and what flows (request, event, notification).
- Show multiplicity — If you have 3 replicas of a service, show it (or annotate "×3"). If a database has a primary and replicas, show the replication arrow.
- Don't overload — If the diagram has more than 15–20 boxes, split it into sub-diagrams. Complexity that can't be seen can't be reviewed.
Common Mistakes
- Boxes without connections — A component that isn't connected to anything doesn't belong in the diagram
- Missing the data store — Every stateful operation must show where the state lives
- No failure path — A good architecture diagram hints at what happens when a component fails (replicas, fallback paths)
- Using it as the only diagram — Architecture diagrams show structure but not behavior. Pair with a sequence diagram to show time-ordered interactions.
Seeing It in Action
Scenario: Architecture diagram for a food delivery platform
┌─────────────────────────────────────────────────────────────────┐
│                        Public Internet                          │
│  ┌──────────┐    ┌──────────┐    ┌──────────┐                  │
│  │ Customer  │    │  Driver   │    │Restaurant│                  │
│  │   App     │    │   App    │    │  Portal  │                  │
│  └────┬──────┘    └────┬─────┘    └────┬─────┘                  │
└───────┼────────────────┼───────────────┼────────────────────────┘
        │ HTTPS          │ WebSocket     │ HTTPS
   ┌────▼────────────────▼───────────────▼────┐
   │              API Gateway                  │
   │     (auth, rate limit, routing)           │
   └──┬──────────┬──────────┬─────────────────┘
      │          │          │
 ┌────▼───┐ ┌───▼────┐ ┌───▼──────┐ ┌──────────┐
 │ Order  │ │Location│ │Matching  │ │Notification│
 │Service │ │Service │ │ Service  │ │  Service  │
 └───┬────┘ └───┬────┘ └───┬──────┘ └────┬─────┘
     │          │          │              │
┌────▼───┐ ┌───▼────┐     │         ┌────▼─────┐
│Order DB│ │ Redis  │     │         │  Kafka   │
│(Postgres)│(geo-idx)│     │         │ (events) │
└────────┘ └────────┘     │         └──────────┘
                     ┌────▼───┐
                     │Matching│
                     │  Cache │
                     └────────┘
Key decisions visible in the diagram:
- WebSocket for driver location (real-time, bidirectional)
- Dedicated Location Service with Redis (geospatial index for driver positions)
- Kafka for event-driven notifications (decoupled from order flow)
- Separate databases per service (microservices pattern)
Interview Questions
Q: What's the difference between a logical architecture diagram and a deployment diagram? When would you use each? Hint: Logical shows components and relationships (design-time). Deployment shows where they run — cloud, region, instance types (ops-time). Use logical in the design phase and interviews; use deployment for production readiness reviews.
Q: How do you represent asynchronous communication vs synchronous in an architecture diagram? Hint: Convention: solid arrows for synchronous (HTTP, gRPC), dashed arrows for asynchronous (message queue, event bus). Always label the protocol. The distinction matters because async introduces eventual consistency and requires different error handling.
Q: You've drawn an architecture diagram with 25 components. The reviewer says it's too complex. How do you simplify? Hint: Group related components into bounded contexts (dashed boxes). Abstract internal details — show "Payment Domain" as one box with a note about its internals. Split into multiple diagrams: one overview, one per domain. The goal is that any single diagram fits on one page.
Q: Why is it important to show data stores explicitly in architecture diagrams? Hint: Every stateful operation must show where state lives. Without data stores, you can't reason about consistency, durability, partitioning, or failure recovery. It's also where bottlenecks usually hide — the database is almost always the first thing to saturate.
Q: How would the architecture diagram change if you needed to support multi-region deployment? Hint: Add region boundaries (dashed boxes for us-east, eu-west). Show data replication arrows between regions. Add a global load balancer / DNS-based routing at the top. Highlight which services are region-local vs global. This reveals new challenges: replication lag, conflict resolution, data residency.
References
- C4 Model for Software Architecture — Simon Brown's structured approach to architecture diagrams at four levels of detail
- AWS Architecture Icons — standard icon set for cloud architecture diagrams
- The System Design Primer — HLD examples for common systems
Dive Deeper
- Software Architecture for Developers by Simon Brown — practical guide to communicating architecture with diagrams
- Diagrams as Code — Structurizr — tool for generating C4 architecture diagrams from code
- Lucidchart Architecture Diagram Guide — best practices for drawing clear architecture diagrams