
Component Diagram
In a Nutshell
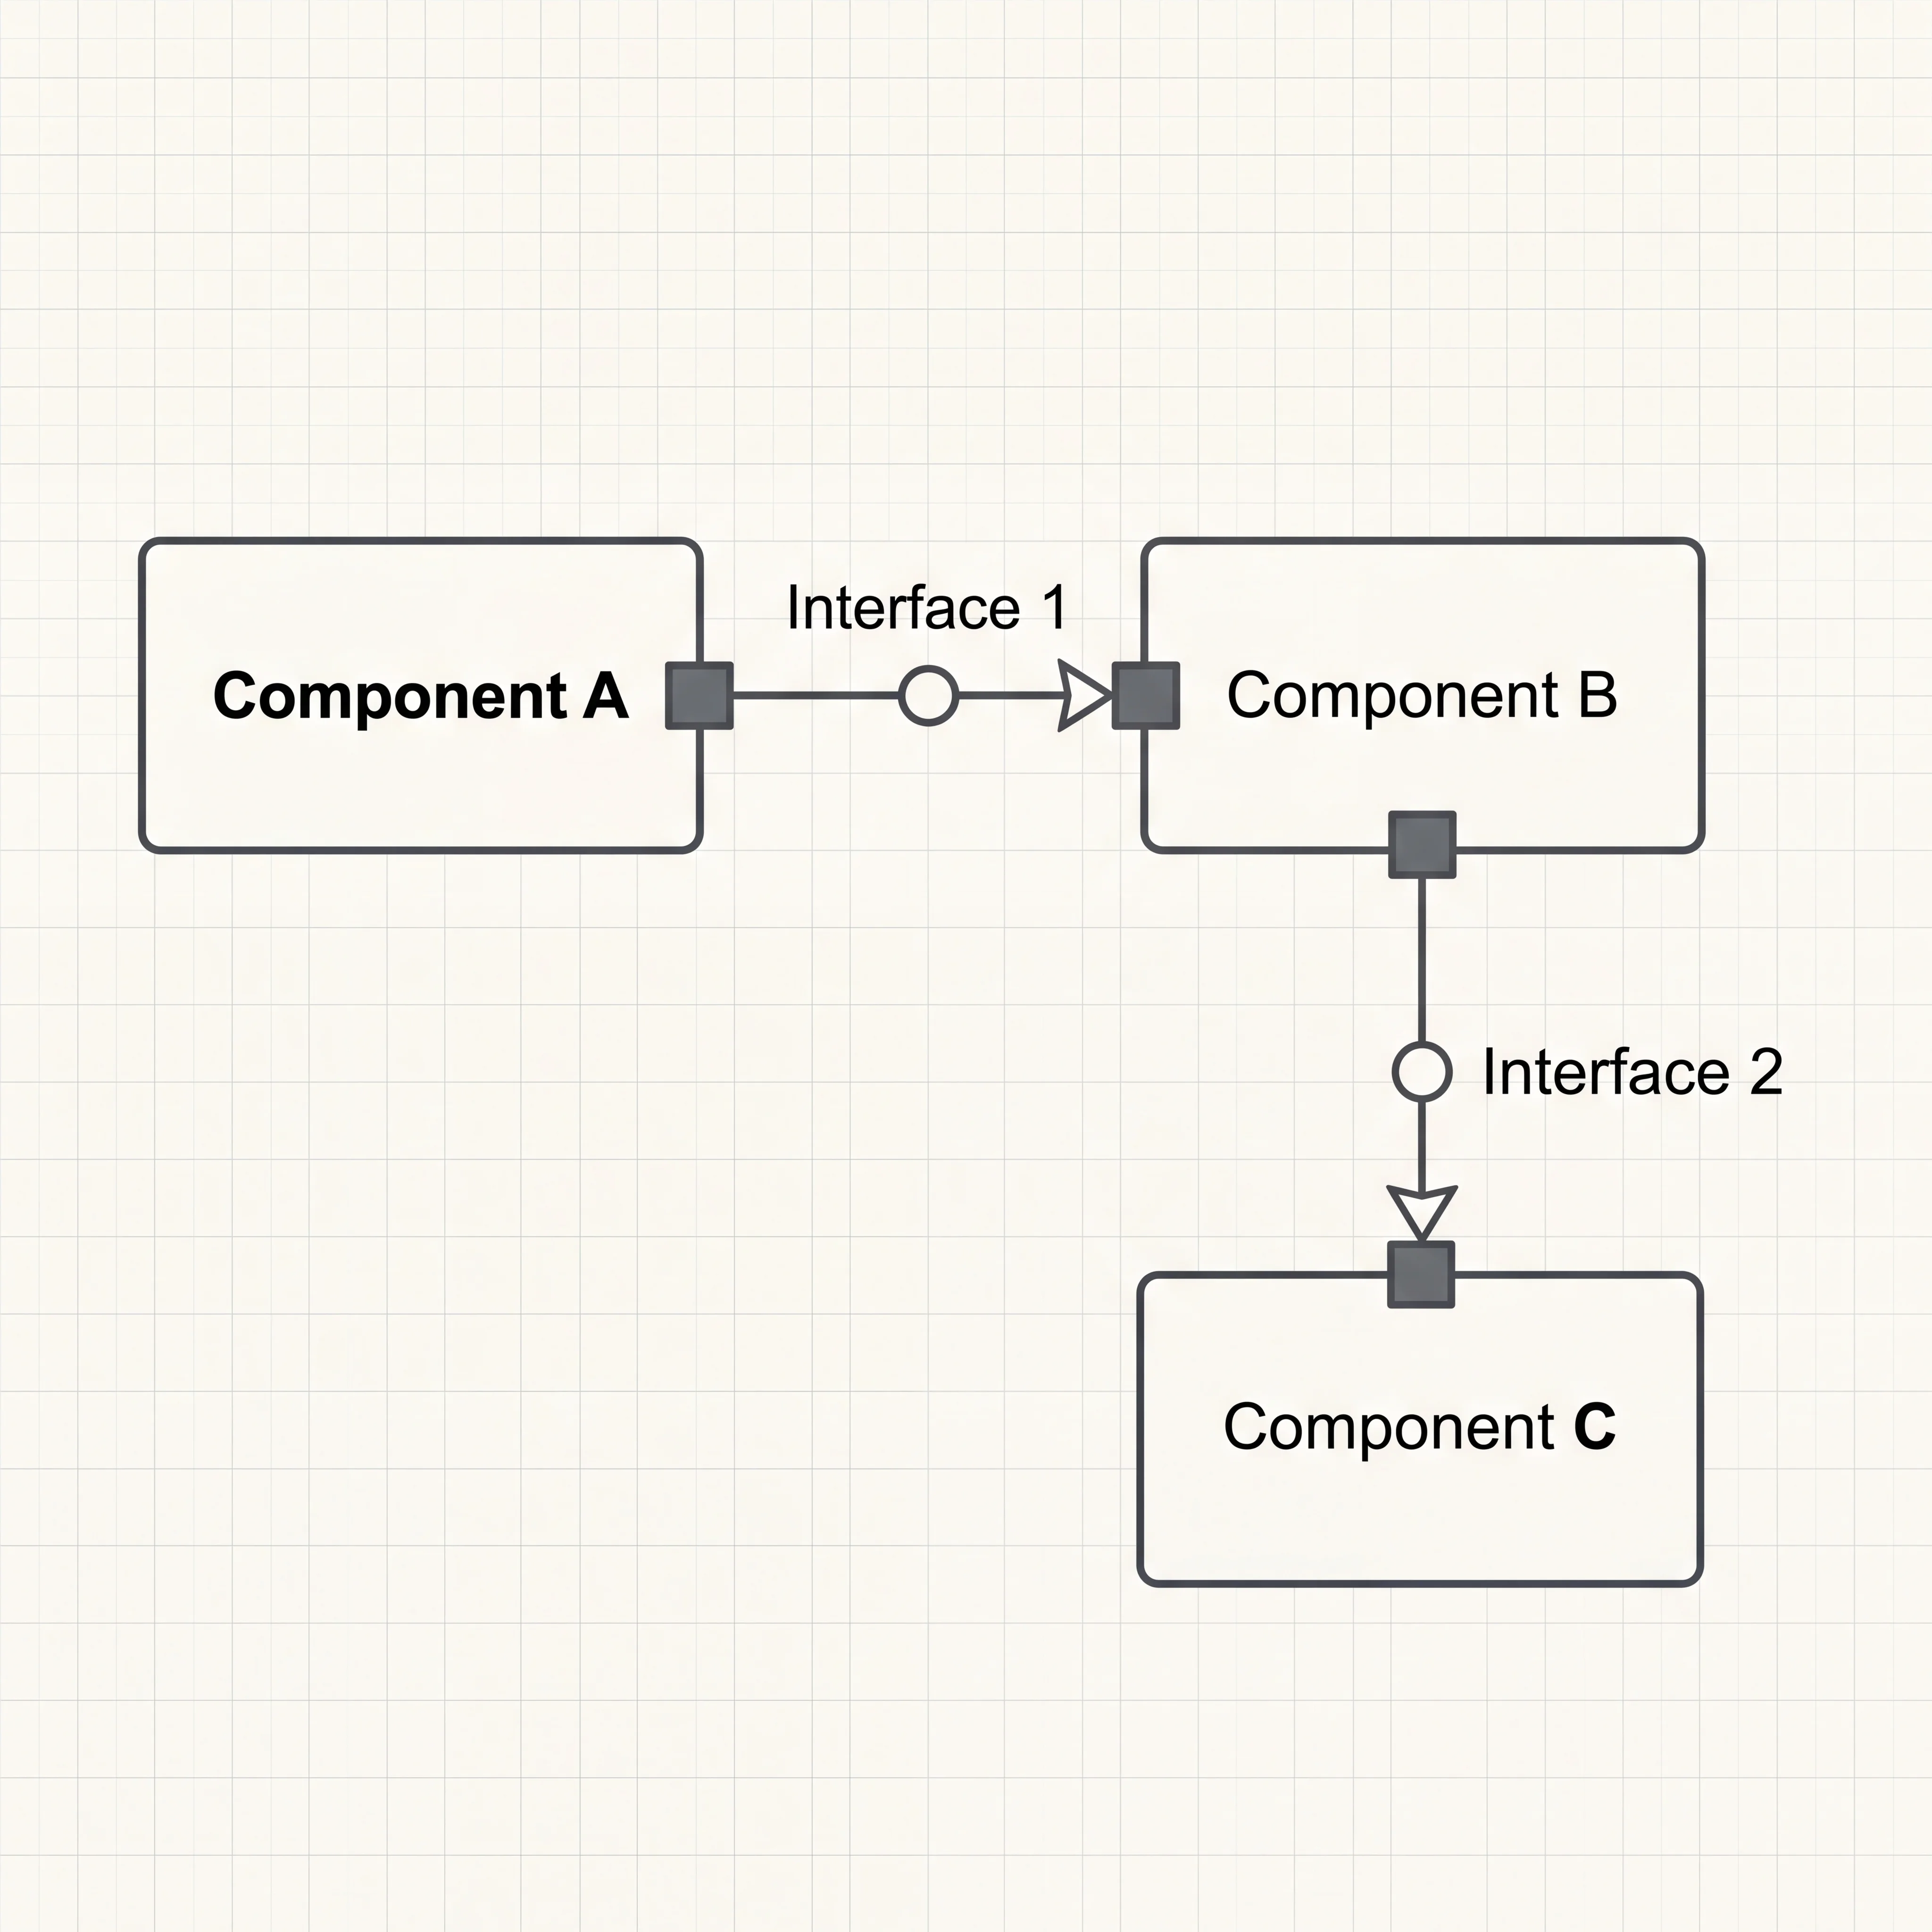
A component diagram shows module dependencies — which parts of your system depend on which other parts. While an architecture diagram shows infrastructure (servers, databases, caches), a component diagram focuses on the logical building blocks (modules, libraries, services) and the interfaces between them. It answers: "What depends on what, and through which interfaces?" This is essential for understanding coupling, planning deployments, and deciding where to draw service boundaries.
How It Actually Works
Notation
| Symbol | Meaning | Example |
|---|---|---|
| Component | Rectangle with «component» stereotype or component icon | OrderService, PaymentModule, AuthLibrary |
| Interface (provided) | Lollipop (circle on a stick) on the component boundary | IPaymentProcessor — this component offers this interface |
| Interface (required) | Socket (half-circle) on the component boundary | IPaymentProcessor — this component needs this interface |
| Dependency | Dashed arrow → | Component A depends on Component B |
| Port | Small square on the component edge | The point where an interface is exposed |
What It Reveals
A good component diagram answers:
- What can be deployed independently? — Components with no cyclic dependencies can be deployed separately
- Where are the coupling risks? — If Component A depends on 8 other components, it's a deployment bottleneck
- What is the blast radius of a change? — Changing an interface affects every component that depends on it
- Where should you draw service boundaries? — Components with heavy internal interaction and light external interaction are natural microservice candidates
When to Use It
- Microservices boundary decisions — "Should these three modules be one service or three?"
- Dependency analysis — "If we change the payment module, what else breaks?"
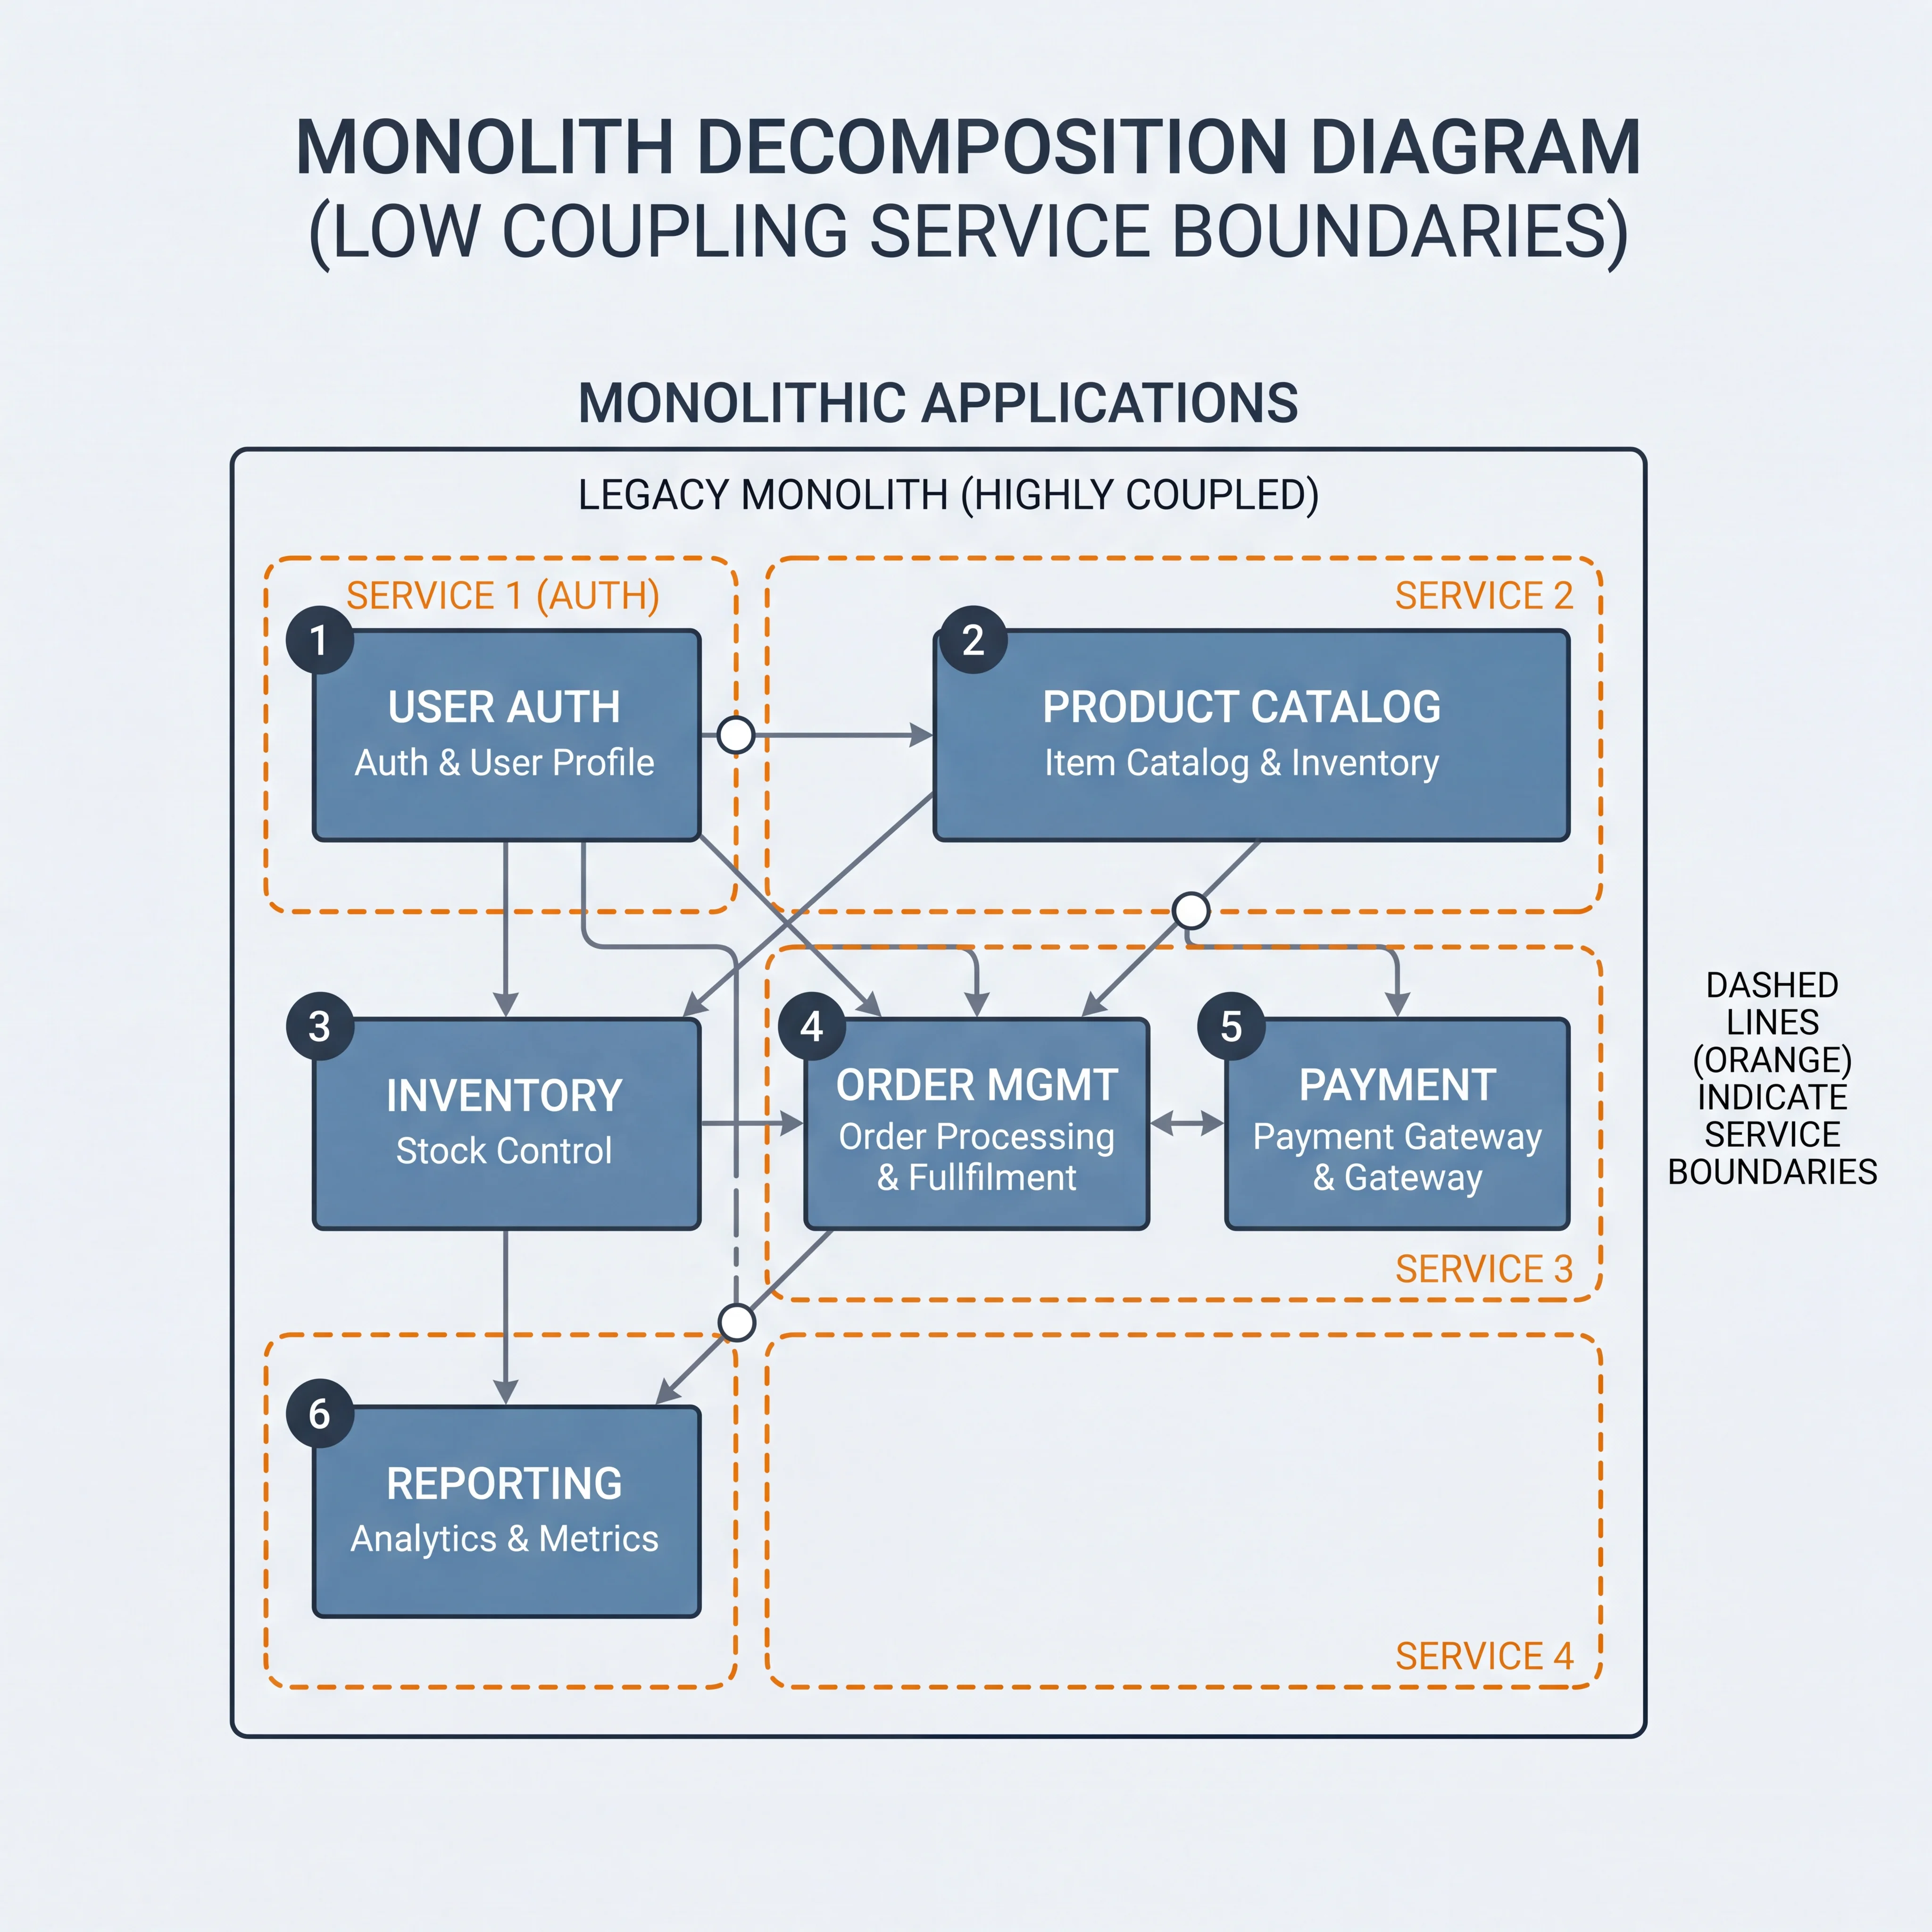
- Monolith decomposition — Mapping the modules inside a monolith to plan extraction into services
- Library/SDK design — Showing which packages depend on which, and which interfaces are public
Seeing It in Action
Scenario: Component diagram for an e-commerce monolith being evaluated for microservice extraction
┌─────────────────────────────────────────────────────────────┐
│                    E-Commerce Monolith                       │
│                                                             │
│  ┌──────────────┐    ┌──────────────┐    ┌──────────────┐  │
│  │   Catalog     │    │    Cart      │    │   Checkout    │  │
│  │   Module      │───▶│   Module     │───▶│   Module     │  │
│  │              │    │              │    │              │  │
│  │ IProductQuery │    │ ICartManager │    │IOrderCreator │  │
│  └──────────────┘    └──────────────┘    └──────┬───────┘  │
│                                                  │          │
│                                           ┌──────▼───────┐  │
│  ┌──────────────┐                         │   Payment    │  │
│  │    User       │                         │   Module     │  │
│  │   Module      │────────────────────────▶│              │  │
│  │              │                         │IPayProcessor │  │
│  │ IUserProfile │                         └──────┬───────┘  │
│  └──────────────┘                                │          │
│                                           ┌──────▼───────┐  │
│                                           │ Notification │  │
│                                           │   Module     │  │
│                                           │              │  │
│                                           │ INotifier    │  │
│                                           └──────────────┘  │
│                                                             │
│  - - - - - - Potential service boundaries - - - - - - - -   │
│  Boundary 1: [Catalog] ← low coupling to rest              │
│  Boundary 2: [Payment + Notification] ← high internal      │
│              coupling, deploy together                       │
└─────────────────────────────────────────────────────────────┘
Insights from this diagram:
- Catalog Module has no inbound dependencies from other modules → easiest to extract as a microservice
- Payment and Notification are tightly coupled (payment always triggers notification) → extract together or keep communication internal
- Cart depends on Catalog (needs product info) → if Catalog becomes a service, Cart needs an API call instead of a direct import
- User Module is depended on by Payment → consider keeping it as a shared library or extracting it early
Interview Questions
Q: How does a component diagram differ from an architecture diagram? Hint: Architecture diagram shows infrastructure (servers, databases, networks). Component diagram shows logical modules and their dependencies/interfaces. You can have multiple components deployed on the same server — the component diagram doesn't care about infrastructure.
Q: How would you use a component diagram to plan a monolith-to-microservice migration? Hint: Map all modules and their dependencies. Identify clusters with high internal coupling and low external coupling — these are natural service boundaries. Start by extracting the module with the fewest inbound dependencies (lowest risk). The component diagram makes coupling visible and quantifiable.
Q: What does a circular dependency in a component diagram tell you? Hint: It means two components can't be deployed or tested independently — they're effectively one unit despite being in separate modules. Fix by extracting the shared dependency into a third component, using dependency inversion (introduce an interface), or merging the components.
Q: How do provided and required interfaces help in system design? Hint: They make contracts explicit. A provided interface says "here's what I offer." A required interface says "here's what I need." This separation lets you swap implementations (Strategy pattern at the system level), mock dependencies for testing, and evolve components independently as long as the interface is stable.
Q: You're designing a plugin system where third parties can add features. How would a component diagram help? Hint: Show the core system as a component with defined extension interfaces (ports). Each plugin is a separate component that implements those interfaces. The diagram makes clear: plugins depend on the core's interfaces, but the core doesn't depend on any plugin — this is the Dependency Inversion principle at the system level.
References
- UML Component Diagram — Visual Paradigm — notation guide with examples
- Clean Architecture by Robert C. Martin — dependency rules and component principles
- C4 Model — Container Diagram — Simon Brown's equivalent of a component diagram for software architecture
Dive Deeper
- Building Evolutionary Architectures by Ford, Parsons & Kua — using component coupling metrics to guide architecture evolution
- ArchUnit — automated architecture testing that enforces component dependency rules in code
- Monolith to Microservices by Sam Newman — practical strategies for decomposing monoliths using dependency analysis